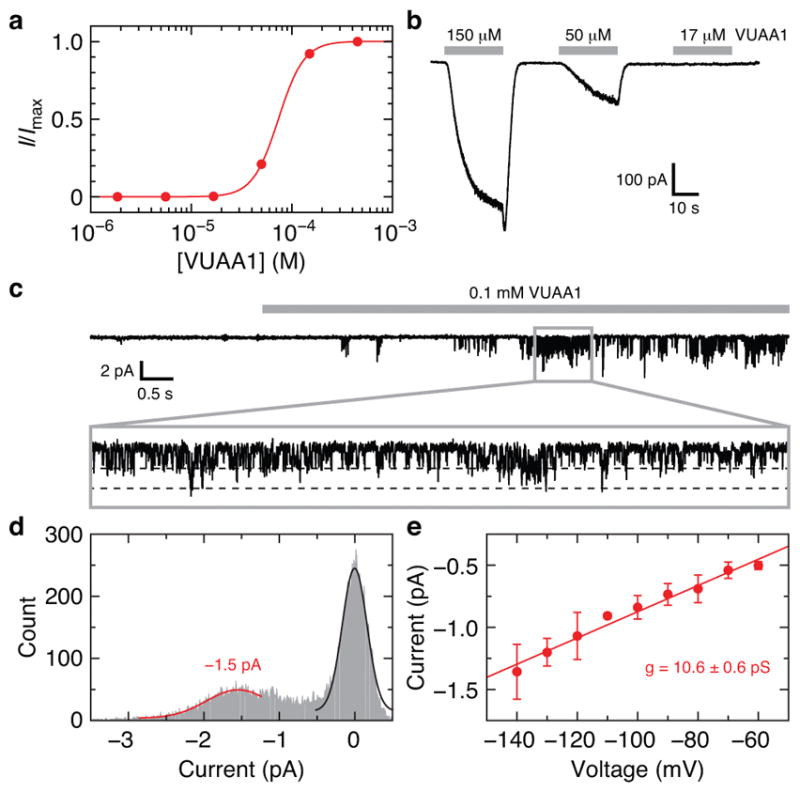
Extended Data Fig. 2. Electrophysiological characterization of Orco.

a, Example VUAA1 dose-response curve using whole-cell current from a HEK293 cell expressing Orco. I/Imax is the measured current relative to the maximum current obtained at the highest concentration of VUAA1. The titration experiment was repeated using four independent cells with equivalent results. The average fitted Hill equation parameters are (mean ± s.d.): EC50 = 64 ± 7 μM, n = 3.5 ± 0.5. b, Inward whole-cell current for a subset of the VUAA1 concentrations used in a (held at −80 mV). c, VUAA1-evoked Orco currents recorded from an outside-out membrane patch from a HEK293 cell expressing Orco (held at −140 mV). Inset (0.9 s) highlights single channel openings. d, Amplitude histogram determined from the inset in c. Fitted Gaussian distributions for single-channel Orco current (red) and baseline current (black) are shown. e, Amplitude histograms were obtained at multiple voltages and the single-channel conductance of 10.6 ± 0.6 pS was determined from the slope of the current-voltage plot (mean ± s.d. for 2–6 data points per voltage from 9 patches). The specific numbers of replicates at each voltage were: 5 (−140 mV), 4 (−130 mV), 5 (−120 mV), 3 (−110 mV), 6 (−100 mV), 4 (−90 mV), 4 (−80 mV), 3 (−70 mV), 2 (−60 mV).
