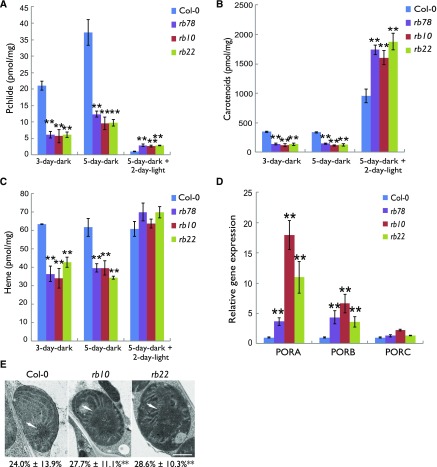
Figure 2.
The rb seedlings accumulate altered amounts of Pchlide, heme, and carotenoids. A to C, Absolute quantification of Pchlide (A), carotenoids (B), and heme (C) in 3-d-old etiolated, 5-d-old etiolated, and 5-d-old etiolated plus 2-d light-grown seedlings.The data for each histogram are means ± SE (n = 4). D, Analysis of PORA/B/C gene expression by RT-qPCR in 5-d-old etiolated seedlings. The expression level of UBQ10 was used as an internal standard. Error bars represent sd (n = 3). E, Transmission electron microscopy images of cotyledon etioplasts from 5-d-old etiolated seedlings. The arrows indicate the PLB. The PLB area as a percentage of host etioplast area is shown under each image and represents the mean ± se (n > 300). Asterisks represent values that are statistically different from that of the wild type sample at the same condition (**, P < 0.01 by Student’s t test).

