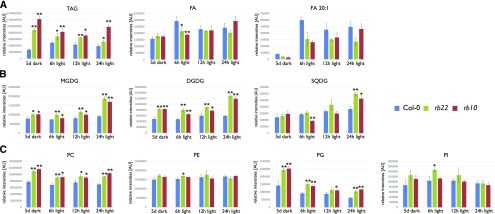
Figure 8.
The mutation of RAPTOR1B has considerable effects on lipid metabolism. Histograms show the relative levels of the indicated lipid classes extracted from Col-0, rb10, and rb22 seedlings. A, Levels of storage lipids (TAGs) and their breakdown products (FAs). B and C, Plastidial lipids (B) and the main lipids from endomembranes (C). All seedlings were grown in darkness for 5 d and then transferred to the light. Samples were collected immediately prior to light exposure (5 d of dark) or after defined periods of light exposure (6, 12, or 24 h of light). The histograms show means of the sums of the individual lipid species of each lipid class ± sd (n = 3). Asterisks represent values that are statistically different from that of the wild-type sample at the same condition (*, P < 0.05 and **, P < 0.01 by Student’s t test). The normalized data of all individual lipid species can be obtained from Supplemental Table S2. AU, Arbitrary units.

