Figure 5.
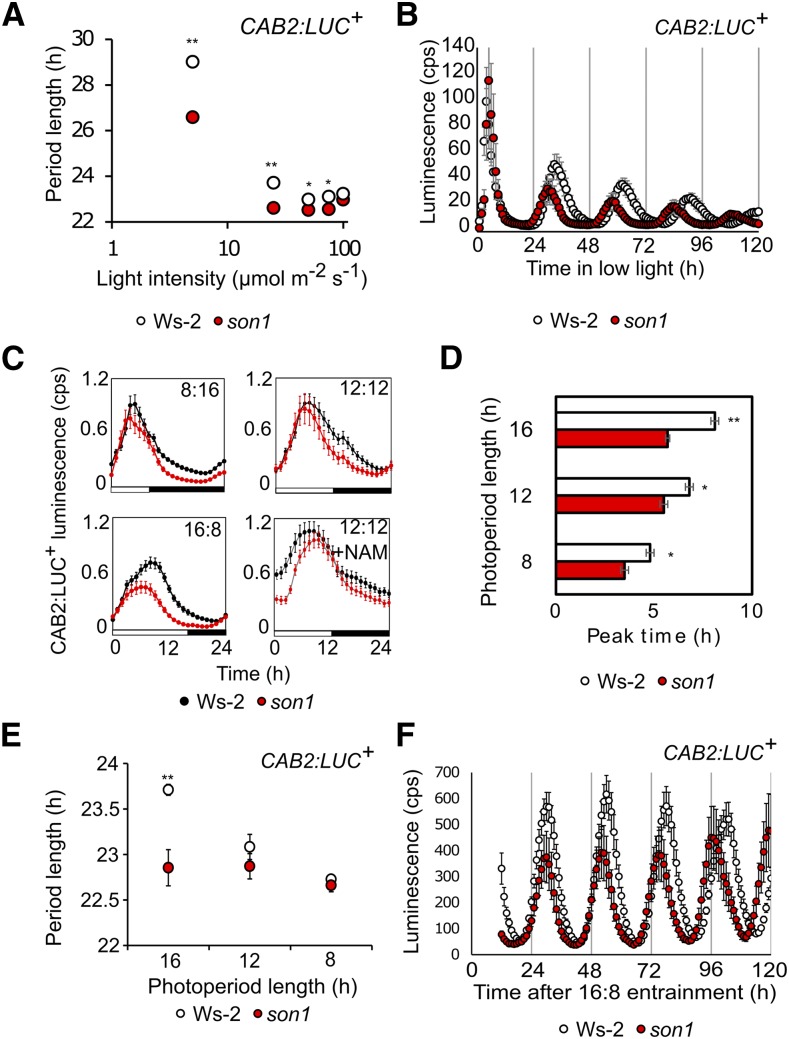
son1 affects dynamic circadian period adjustment by light and photoperiod. A, Fluence response curve for circadian period of CAB2:LUC+ in Ws-2 and son1 estimated in equal mixed red and blue light (means ± se; n = 8–12). Data are pooled from three independent experiments. B, CAB2:LUC+ rhythm of son1 and Ws-2 assayed over 5 d in constant 5 µmol m−2 s−1 equal mixed red and blue light (means ± se; n = 8). Data are representative of two independent experiments in the BC2F3 generation. In A, the small error bars are obscured by symbols. C, CAB2:LUC+ luminescence (counts s−1) from son1 (red) and Ws-2 (black) seedlings grown in 8:16, 12:12, and 16:8 photoperiods. Plants grown in 12:12 were treated with medium supplemented with or without 20 mm nicotinamide (NAM) 2 d prior to entrainment in a camera chamber (means ± se; n = 8). Plants were grown in entrainment conditions from germination and transferred to the camera chamber 1 d before imaging, maintaining the same entrainment regime. Data are representative of three independent experiments. D, Peak time of CAB2:LUC+ from the light/dark cycles in C. The mean peak time of CAB2:LUC+ ± se is plotted (n = 8). E, Photoperiod response curve for the circadian period of CAB2:LUC+ in Ws-2 and son1 estimated in equal mixed 80 µmol m−2 s−1 red and blue light (means ± se; n = 8). Data are pooled from two independent experiments. Plants were entrained in photoperiods of 16, 12, or 8 h prior to transfer to constant light. F, CAB2:LUC+ rhythm of son1 and Ws-2 entrained in a 16:8 light/dark cycle and released into constant light for 5 d (means ± se; n = 8). Asterisks indicate P < 0.05 with Student’s t test.

