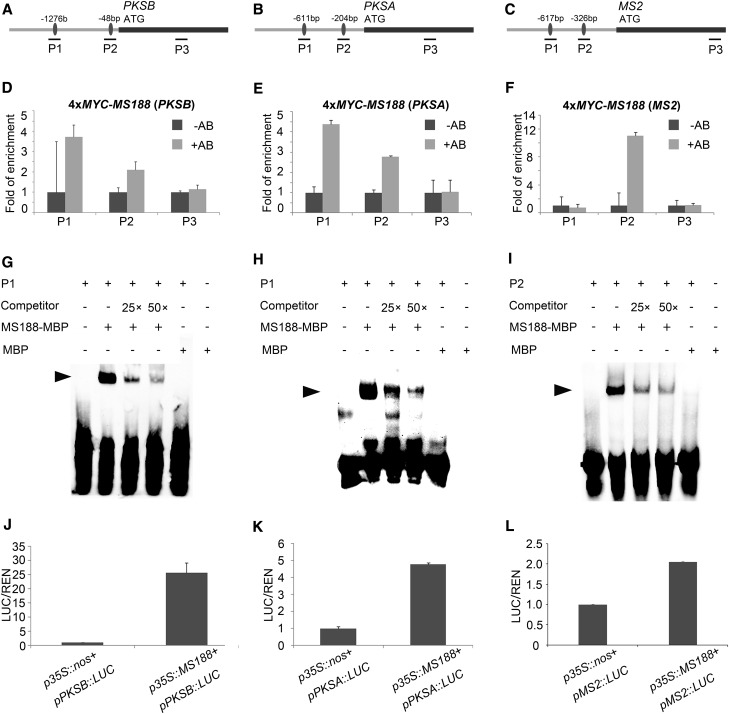
Figure 3.
Transcription factor MS188 directly regulates the expression of PKSA, PKSB, and MS2. A to C, The designed probes of PKSB, PKSA, and MS2, respectively. Probe 1 (P1) and P2 contain the binding sites (black dots) of MS188, and P3 was designed in the coding region as a control. The black lines show the fragments of the probes for the ChIP-qPCR assay. D to F, The fragments of the above probes in PKSB, PKSA, and MS2 promoters specifically amplified by ChIP-qPCR using 4xMYC-MS188 transgenic plant samples. The fold of enrichment is the average of three replicates, and sd is indicated as error bar. −AB, absence of antibody; +AB, presence of antibody. G to I, EMSA assay showing MS188 binding to probes in vitro. The first panel represents free probe, and the last panel indicates the mixture of free probe and MBP tag; both are used as negative controls. The shift band is indicated by the arrowhead, which is highlighted by the positive control of mixture of biotin-tagged probe and non-biotin-tagged probe and MBP-MS188. J to L, p35s::MS188 was cotransformed with pPKSB::LUC, pPKSA::LUC, and pMS2::LUC, respectively, and a transient dual-luciferase assay was conducted in the Arabidopsis protoplasts. Three replicates were performed, and the y axis is shown as the ratio of Luciferase/Renilla. sd is indicated as error bar.

