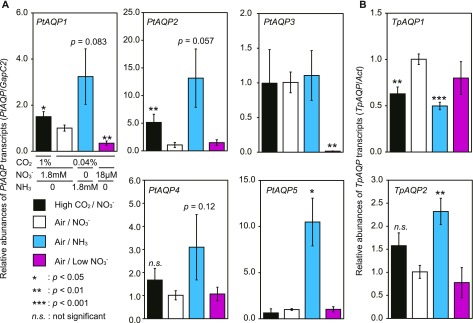
Figure 3.
Gene expression levels of PtAQPs and TpAQPs. The responses of PtAQP and TpAQP transcript levels to CO2 and nitrogen were quantified by RT-qPCR. Transcript levels are shown for PtAQP1, PtAQP2, PtAQP3, PtAQP4, or PtAQP5 in P. tricornutum and TpAQP1 or TpAQP2 in T. pseudonana grown in 1% CO2 (high CO2/NO3−; black bars), 0.04% CO2 (air/NO3−; white bars), with the addition of 1.8 mm NH4Cl (air/NH3; cyan bars) or 18 µm NaNO3 (air/low NO3−; magenta bars). The transcripts of GapC2 in P. tricornutum and Act in T. pseudonana were used as constitutive internal controls. A, PtAQPs in P. tricornutum. B, TpAQPs in T. pseudonana. All data are means ± sd (n = 3). Welch's t tests were performed between the air/NO3− condition as the reference and all treatment conditions (*, P < 0.05; **, P < 0.01; ***, P < 0.001; and n.s., not significant).

