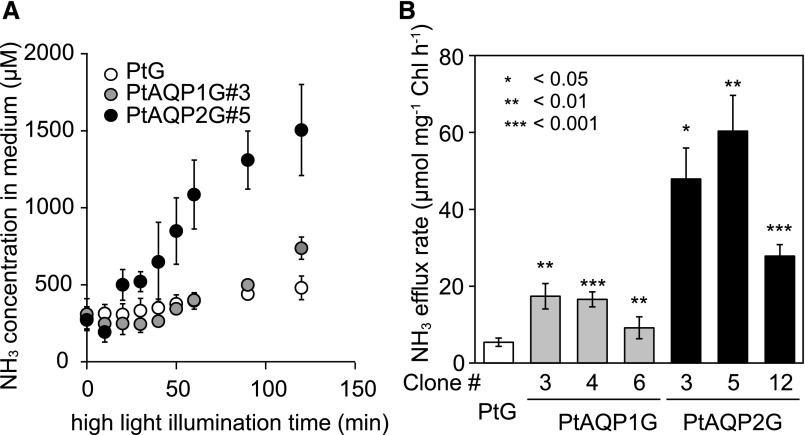
Figure 5.
NH3 efflux in diatom cells expressing PtAQP1 or PtAQP2. A, Time course of changes in NH3 concentration in the external medium of cell cultures of PtG (white circles), PtAQP1G#3 (gray circles), and PtAQP2G#5 (black circles) grown in 0.04% CO2. NH3 concentration was monitored from the start of high-light illumination (1,500 μmol m−2 s−1) for 120 min. B, Maximum rates of NH3 efflux in cell cultures of PtG (white bar), PtAQP1G#3, PtAQP1G#4, and PtAQP1G#6 (gray bars), and PtAQP2G#3, PtAQP2G#5, and PtAQP2G#12 (black bars). Student's t tests were performed between PtG and PtAQPnGs (*, P < 0.05; **, P < 0.01; and ***, P < 0.001).

