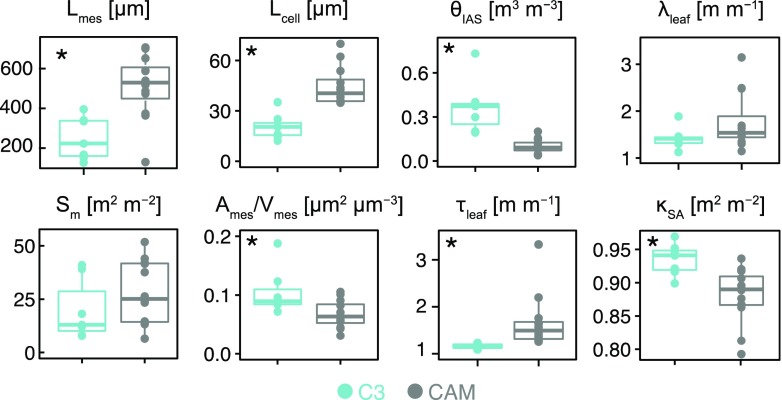
Figure 4.
Leaf anatomical trait values for the 19 Bromeliaceae species studied. For C3 (blue; δ13C < −20‰; n = 7) and CAM (gray; δ13C > −20‰; n = 12) bromeliads (see Table 1 for a full species list), mesophyll thickness (Lmes; µm), mesophyll surface area per leaf area (Sm; m2 m−2), average cell diameter (Lcell; µm), mesophyll surface area exposed to the IAS per mesophyll volume (Ames/Vmes; µm2 µm−3), IAS porosity (θIAS; m3 m−3), IAS tortuosity (τleaf; m m−1), lateral path lengthening (λleaf; m m−1), and IAS connectivity on a mesophyll-surface-area basis (κSA; m2 m−2) are shown. Asterisks in the top left corner of the plots indicate significant differences (P < 0.05) between CAM and C3 bromeliads based on a phylogenetic paired Student’s t test.

