Figure 3.
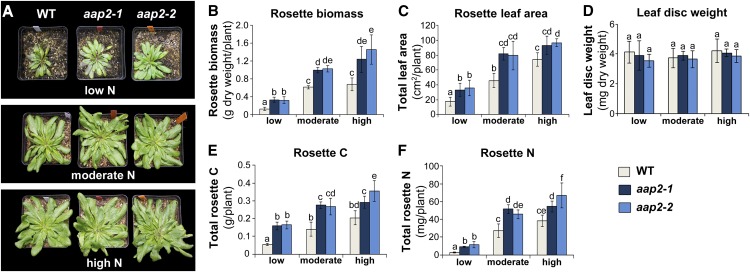
Analysis of leaf development and total elemental N and C content in rosette leaves of Arabidopsis aap2 and wild-type (WT) plants. Plants were grown in 12-h days for 5 weeks under low-, moderate-, or high-N conditions. A, Composite images of two aap2 mutant lines and wild-type plants exposed to the different N regimes. Photographs of single plants were put together on black backgrounds, assembled in a panel, and labeled using Adobe Photoshop CS5. B, Total dry weight of source rosette leaves per plant (n ≥ 4). C, Total surface area of rosette leaves (n ≥ 3). D, Weight of rosette leaf discs with 2-cm2 surface area (n ≥ 5). E, Total C content of rosette leaves per plant (n = 5). F, Total N content of rosette leaves per plant (n = 5). Data are means ± sd. Significant differences are indicated by letters (ANOVA; P ≤ 0.05).

