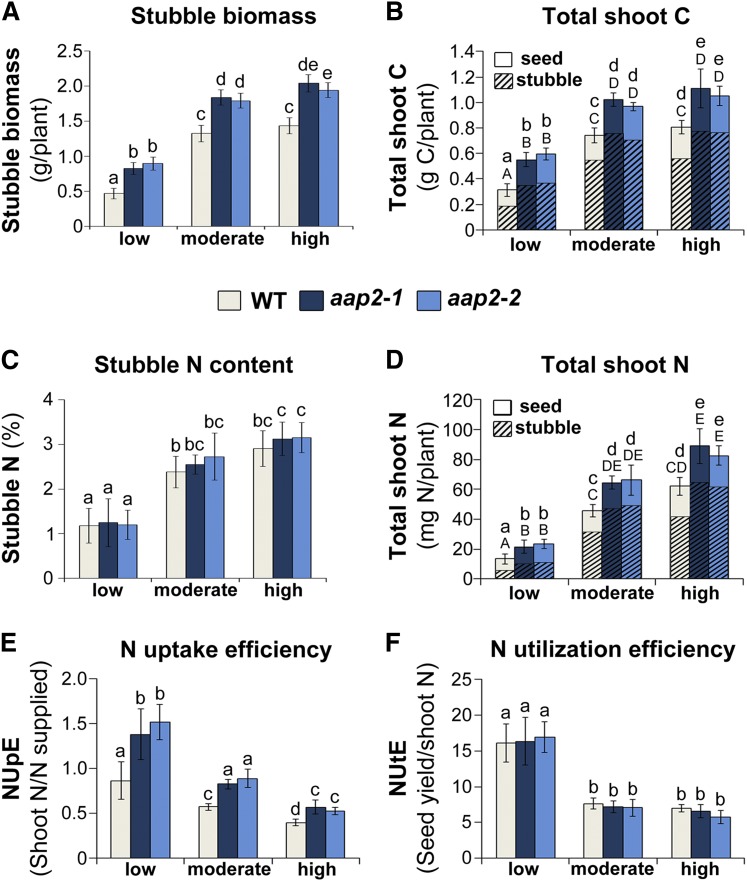
Figure 6.
Analysis of stubble biomass, shoot C and N distribution, NUpE, and NUtE of Arabidopsis aap2 and wild-type (WT) plants at harvest. Plants were grown in 16-h days for 8 weeks under low-, moderate-, or high-N conditions. Stubble includes rosette and cauline leaves, stems, and silique walls and excludes seeds. For total shoot analyses, all aboveground tissue was used (i.e. stubble and seeds). A, Stubble dry weight per plant (n = 6). B, Total shoot C as a sum of stubble and seed C per plant (n = 6). C, N content of stubble in percentage (n = 6). D, Total shoot N as a sum of stubble and seed N per plant (n = 6). E, Plant NUpE, calculated based on total shoot N relative to N supply (n = 6). F, Plant NUtE, calculated based on seed yield relative to total shoot N (n = 6). Data are means ± sd. Significant differences are indicated by letters (ANOVA; P ≤ 0.05).

