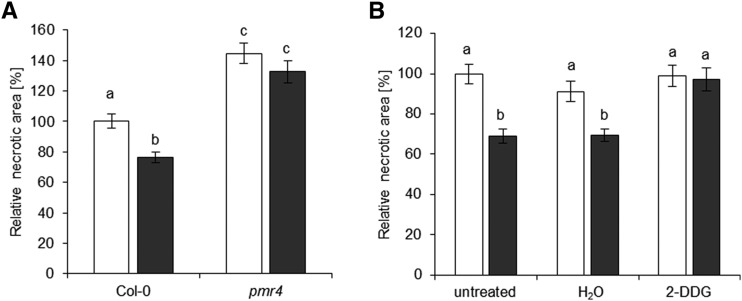
Figure 10.
Plants impaired in callose formation display a loss in NO2-induced resistance against B. cinerea. A, Col-0 and callose-deficient pmr4 plants were subjected to B. cinerea droplet infection 6 h after fumigation with 10 µL L−1 NO2 for 1 h. Necrotic areas formed on fumigated leaves after 3 d were normalized to the mean necrotic areas of the respective unfumigated leaves. Columns represent means of four independent experiments ± se (n = 135–145). B, Relative necrotic areas determined on Col-0 plants that were infiltrated with 1.2 mm of the callose synthesis inhibitor 2-DDG (water as a control) 24 h before fumigation followed by B. cinerea infection. Columns represent means ± se (n = 70–130). Letters indicate significant differences of all pairwise comparisons via the Kruskal-Wallis test plus Dunn’s posthoc test (P < 0.05). White columns, unfumigated; black columns, 10 µL L−1 NO2.

