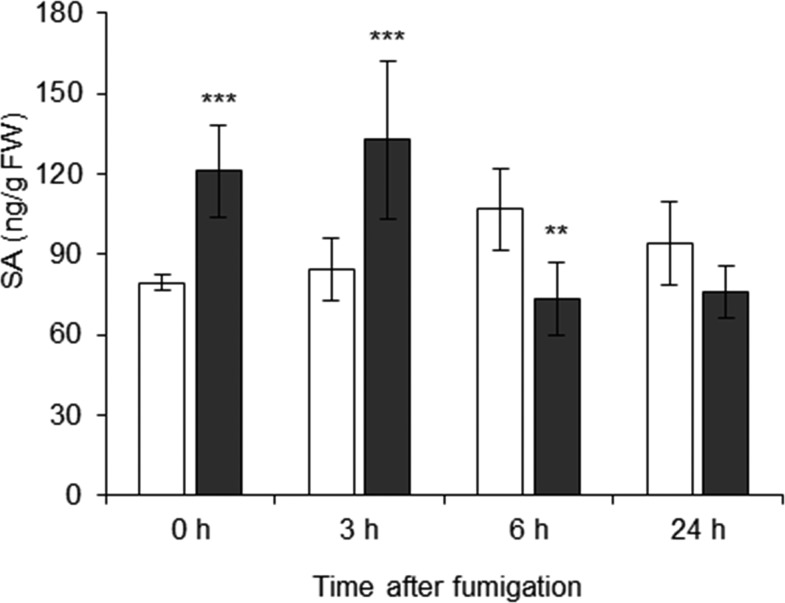
Figure 4.
NO2 induces signaling by SA. SA levels at different time points after fumigation with air or 10 µL L−1 NO2 were measured via LC-MS/MS and normalized to the samples’ fresh weight (FW). Columns represent means ± sd (n = 5). Asterisks indicate significant differences within the time points as determined by two-way ANOVA plus the Holm-Sidak posthoc test (**, P < 0.01 and ***, P < 0.001). White columns, air; black columns, 10 µL L−1 NO2.

