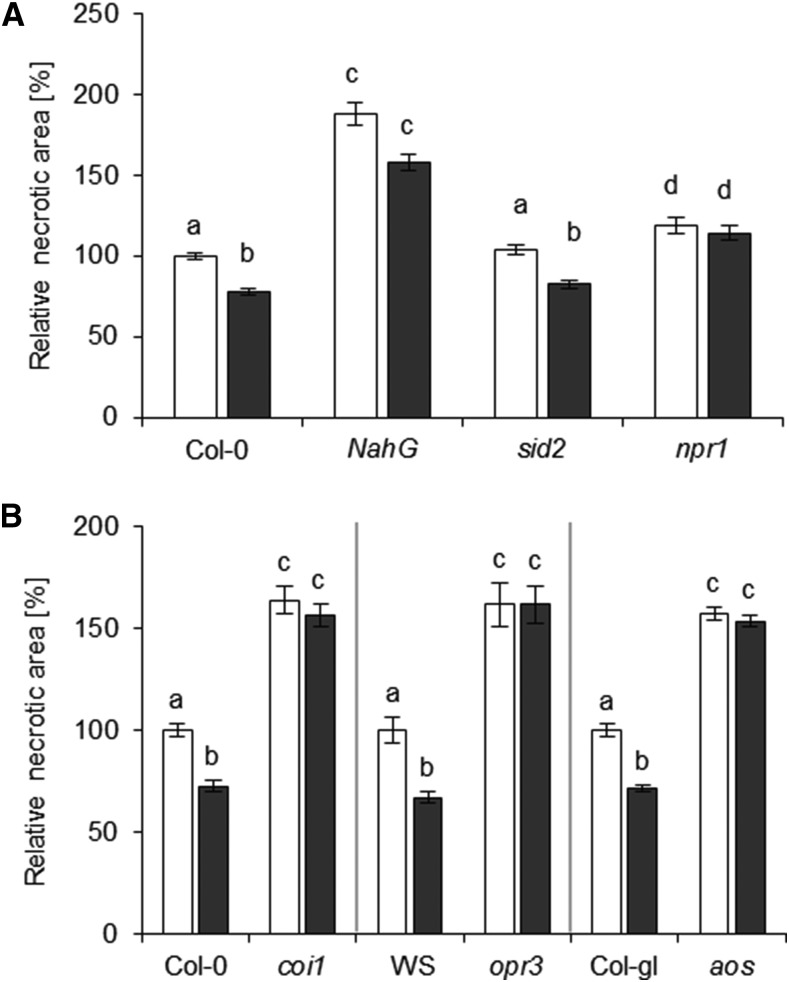
Figure 7.
SA and JA function in NO2-induced resistance against B. cinerea. Mutants were subjected to B. cinerea droplet infection 6 h after fumigation with 10 µL L−1 NO2 for 1 h. Necrotic areas were measured 3 d later and were normalized to the mean necrotic area of the respective unfumigated wild type. A, SA-deficient (NahG and sid2) or SA-signaling (npr1) mutants and the corresponding Col-0 wild type. Columns represent means of at least three independent experiments ± se (n = 95–331). B, JA-deficient (aos and opr3) or JA-signaling (coi-1) mutants and corresponding wild-types (Col-gl for aos, Wassilewskija [WS] for opr3, and Col-0 for coi-1). Columns represent means of three independent experiments ± se (n = 66–126). Letters indicate significant differences of all pairwise comparisons via the Kruskal-Wallis test plus Dunn’s posthoc test (P < 0.05). White columns, unfumigated; black columns, 10 µL L−1 NO2.

