Figure 1.
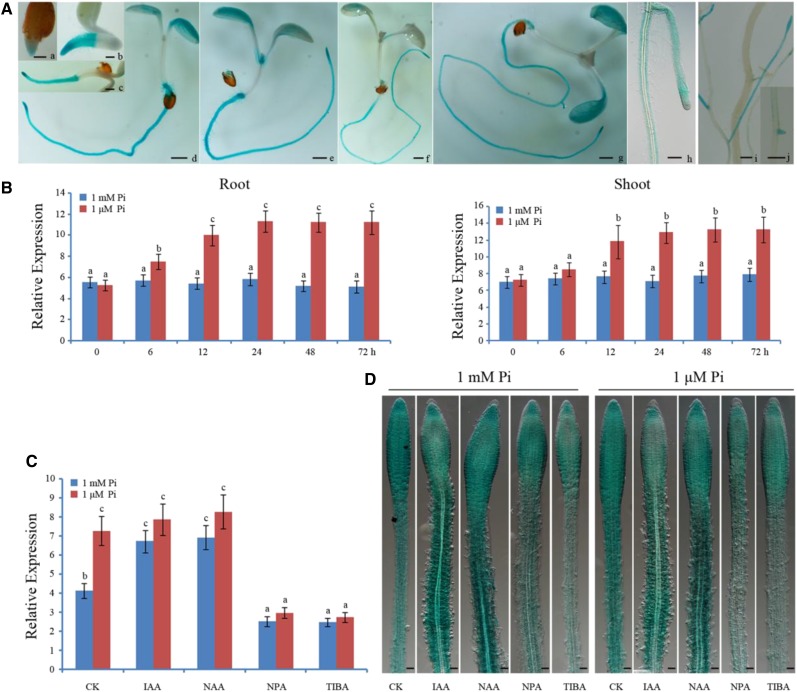
Expression profiles of PHR1 in Arabidopsis. A, Expression of GUS in PHR1p:GUS transgenic Arabidopsis. Histochemical assay of GUS activity in 1- (a), 2- (b), 3- (c), 4- (d), 5- (e), 6- (f), 7- (g), and 14-d-old seedlings (h) on 1 mm Pi medium and in roots of 25-d-old plant grown in soil (i and j). Bars = 100 μm. B, Expression analysis of PHR1 in roots and shoots. Five-day-old seedlings were transferred to 1 μm Pi for 0, 6, 12, 24, 48, and 72 h, and then total RNA was isolated from roots and shoots for reverse transcription quantitative PCR (RT-qPCR) analysis. The data are presented as means ± sd. The significance of differences was analyzed by Duncan’s test (P < 0.05; n = 9). Different lowercase letters indicate statistically significant differences. C, RT-qPCR analysis of PHR1 expression in roots treated with auxin (0.05 μm IAA or 0.05 μm NAA) and auxin transport inhibitors (10 μm NPA or 10 μm TIBA) for 24 h under 1 mm Pi or 1 μm Pi conditions, respectively. CK, Nontreated control. The data are presented as means ± sd. The significance of differences was analyzed by Duncan’s test (P < 0.05; n = 9). Different lowercase letters indicate statistically significant differences. D, Expression of GUS in roots of PHR1p:GUS transgenic Arabidopsis treated with auxin (0.05 μm IAA or 0.05 μm NAA) and auxin transport inhibitors (10 μm NPA or 10 μm TIBA) for 24 h under 1 mm Pi or 1 μm Pi conditions, respectively.

