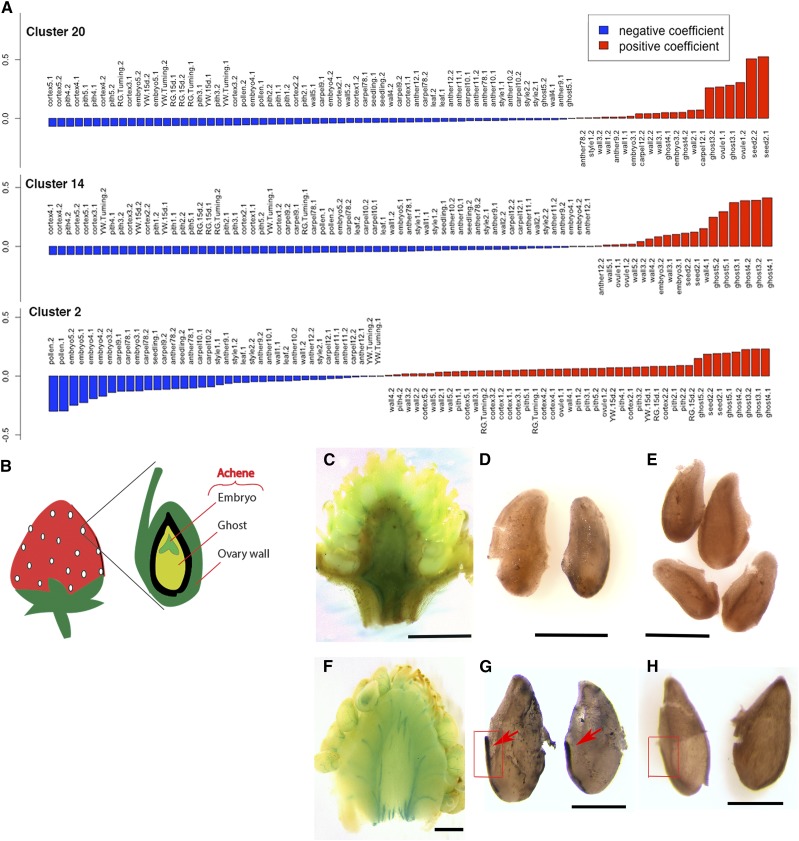
Figure 2.
Ghost-associated clusters indicate active iron transport postfertilization. A, Eigengene expression values of clusters 20, 14, and 2 in different tissues. Highest eigengene values are with seed (cluster 20) and ghost (cluster 2 and 14). B, Diagram of the strawberry receptacle in relation to the achene, which consists of the ovary wall and seed. Each seed houses the ghost (endosperm and seedcoat) and embryo. C, Perls staining of the prefertilization (stage 1) receptacle. D, DAB-enhanced Perls staining of iron in fixed ovules at prefertilization. No difference is seen from the DAB-only control in E. E, DAB-only staining of fixed ovules at prefertilization. F, Perls staining of the receptacle at stage 3 (postfertilization). Blue lines are stained vascular strands connecting the receptacle to individual achenes. G, DAB-enhanced Perls staining of iron in fixed stage 3 seeds (postfertilization). Strong vascular strand staining is seen along the side of the seeds (arrows). This positive staining contrasts with the negative control (rectangle) shown in H. H, DAB-only staining of fixed stage 3 seeds. Scale bars in C and F, 1 mm; in D, E, G, and H, 0.4 mm.

