Figure 3.
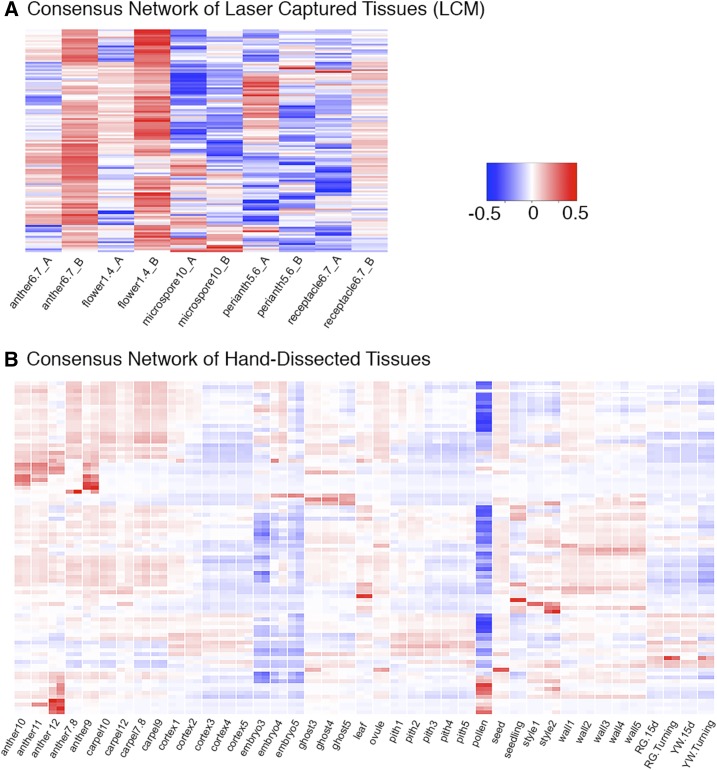
Consensus network analyses of LCM and HD flower, fruit, and vegetative tissues. A, Heat map showing cluster-tissue associations of the consensus LCM network. A total of 123 clusters were identified. Each row corresponds to a cluster. Each column corresponds to a specific tissue/stage. The color of each cell at the row-column intersection indicates the eigengene value. Blue color indicates a negative association and red color indicates a positive association between the cluster and the tissue. Specific eigengene values are provided in Supplemental Data Set S2. B, Heat map showing cluster-tissue association of the consensus_HD network. Eighty-six clusters were identified. Two replicates of each tissue are labeled with one name at the bottom.

