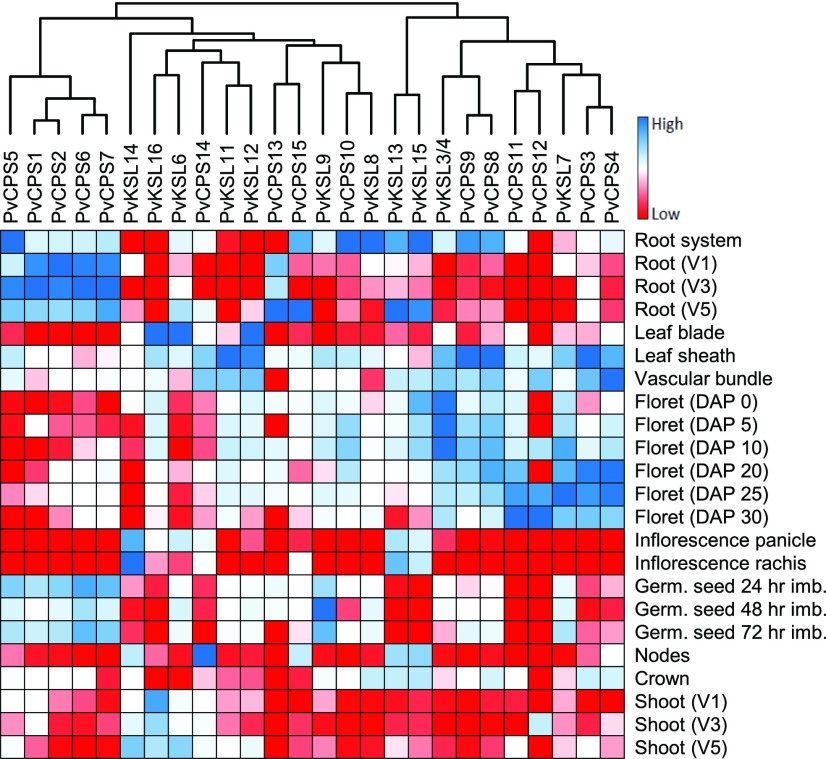
Figure 7.
Hierarchical cluster analysis of diTPS expression profiles across switchgrass tissues. The heat map shows the relative transcript abundance for each diTPS gene candidate in FPKM (fragments per kilobase of transcript per million mapped reads) expression profiles of 23 different untreated switchgrass plant tissues (https://phytozome.jgi.doe.gov/). Transcript levels for PvKSL1, PvKSL2/5, and PvKSL10 were not detected. DAP, Days after pollination; V, vegetative stage.

