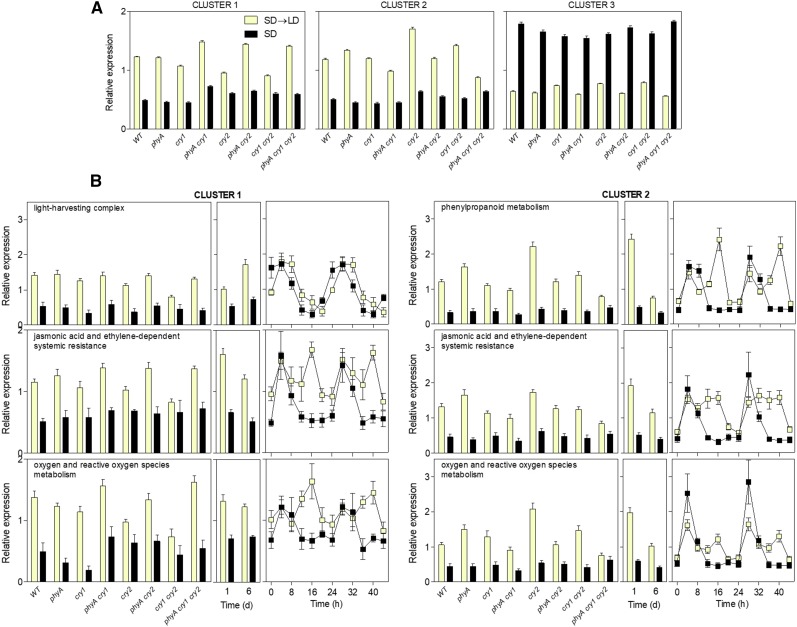
Figure 1.
Robust responses of the transcriptome to initial LD exposure. A, Three major clusters grouped 749 genes showing statistically significant responses to photoperiod. Plants of Arabidopsis accession Landsberg erecta were grown under SD for 3 weeks, then transferred to LD, and harvested after the end of the first LD photoperiod (experiment 1; Supplemental Fig. S1A). The expression of each gene was normalized to the average for that gene across the genotypes and treatments, and then the cluster average and se were calculated for each genotype and condition. B, For each overrepresented GO term and cluster, average normalized expression and se for each genotype and condition are shown in boxes corresponding to (left to right) experiment 1, experiment 2 (Supplemental Fig. S1A; an independent experiment with accession Columbia following the same protocol as experiment 1 but followed up for 6 d), and publicly available data (Supplemental Fig. S1B; a time course corresponding to plants of accession Landsberg erecta grown continuously under either SD or LD [Michael et al., 2008]). WT, Wild type.

