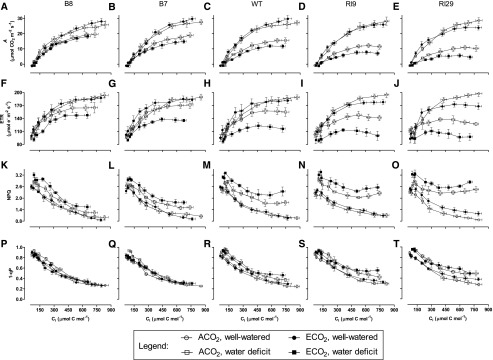
Figure 2.
Photosynthetic parameters in leaf 5 of tobacco. CO2 response curves are shown for A (A–E), ETR (F–J), NPQ (K–O), and 1 − qP (P–T) in B8 (A, F, K, and P), B7 (B, G, L, and Q), the wild type (C, H, M, and R), RI9 (D, I, N, and S), and RI29 (E, J, O, and T). Data are shown for well-watered ACO2-grown plants (white circles), well-watered ECO2-grown plants (black circles), ACO2-grown plants experiencing a moderate water deficit (white squares), and ECO2-grown plants experiencing a moderate water deficit (black squares). Measurements were done at saturating irradiance (1,600 PPFD). Each experiment included single individuals for each plant line and growth condition. Data are means ± se of five independent experiments (n = 5).

