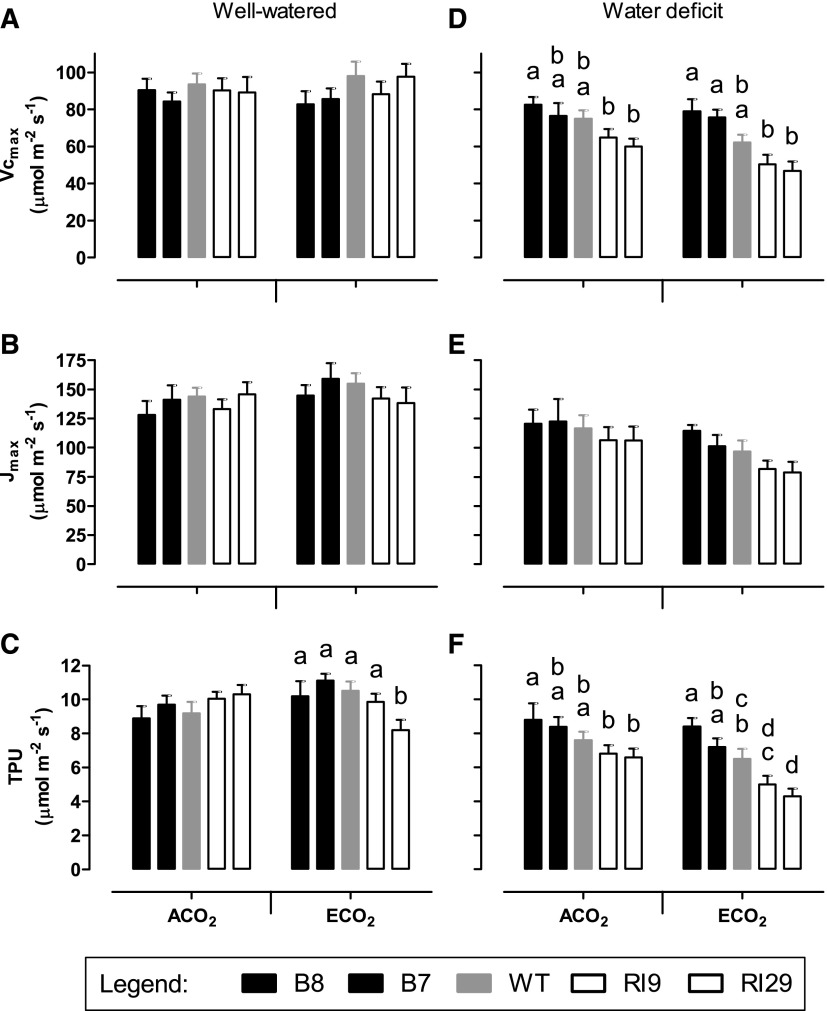
Figure 3.
Photosynthetic parameters in leaf 5 of tobacco. Plants were grown at ACO2 or ECO2 and either well watered (A–C) or experiencing a moderate water deficit (D–F). A and D, Vcmax. B and E, Jmax. C and F, TPU. Data are presented for the wild type (WT; gray bars), AOX overexpressors (B8, left black bars; B7, right black bars), and AOX knockdowns (RI9, left white bars; RI29, right white bars). These data are calculated from the A/Ci curves shown in Figure 2. Each experiment included single individuals for each plant line and growth condition. Data are means ± se of five independent experiments (n = 5). Within a growth condition, plant lines not sharing a common letter are significantly different from one another (P < 0.05). In data sets without letters, there are no significant differences across plant lines.

