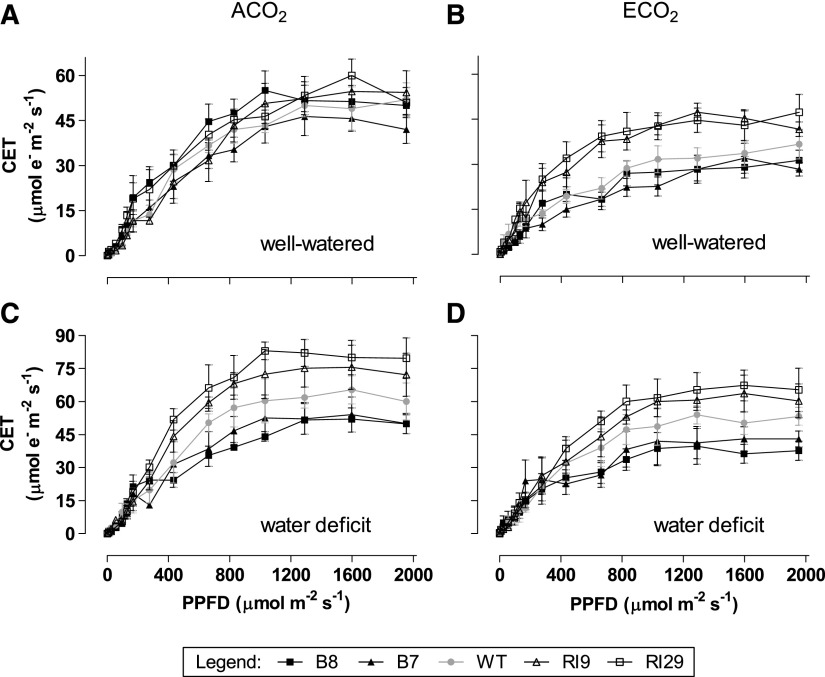
Figure 8.
Rates of CET in leaf 5 of tobacco. Plants were grown at ACO2 (A and C) or ECO2 (B and D) and either well watered (A and B) or experiencing a moderate water deficit (C and D). Data are presented for the wild type (WT; gray circles), B7 (black triangles), B8 (black squares), RI9 (white triangles), and RI29 (white squares). Measurements were done at growth Ca (i.e. 400 or 1,000 µmol mol−1). Each experiment included single individuals for each plant line and growth condition. Data are means ± se of three independent experiments (n = 3).

