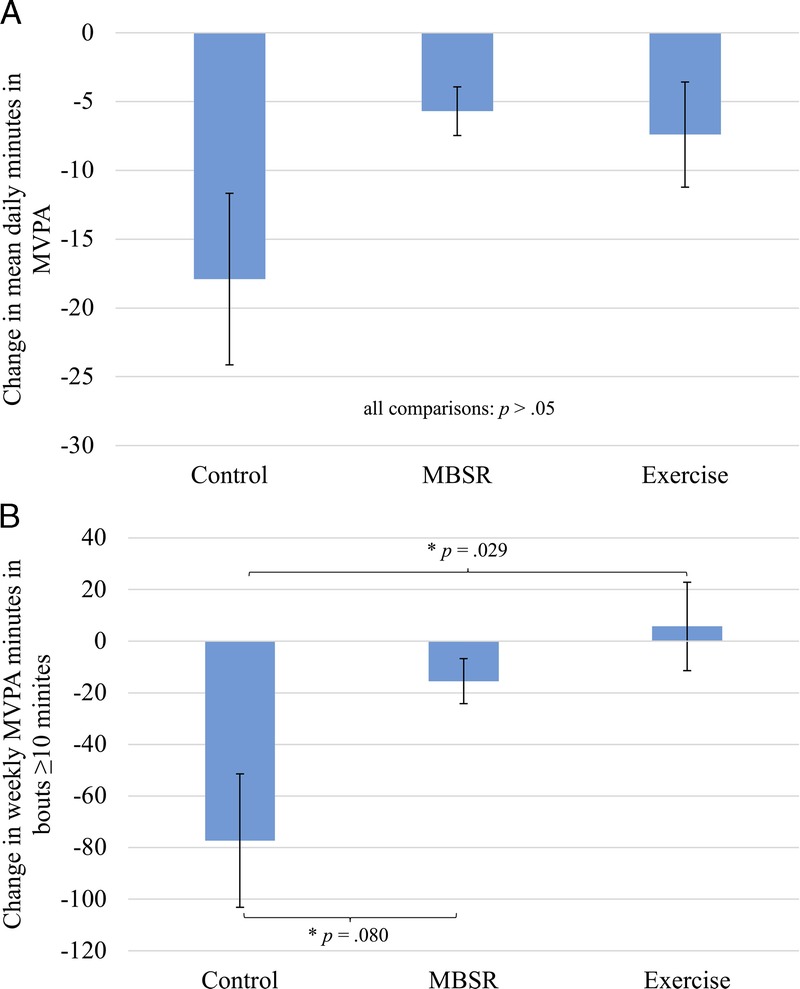
FIGURE 2.

Mean changes across the 8-wk interventions by group for overall daily MVPA (A) or weekly minutes in MVPA in bouts of at least 10 min (B) (error bars represent the standard error of the mean). P values indicate pairwise comparisons of change scores across the intervention between groups. *P < 0.05.
