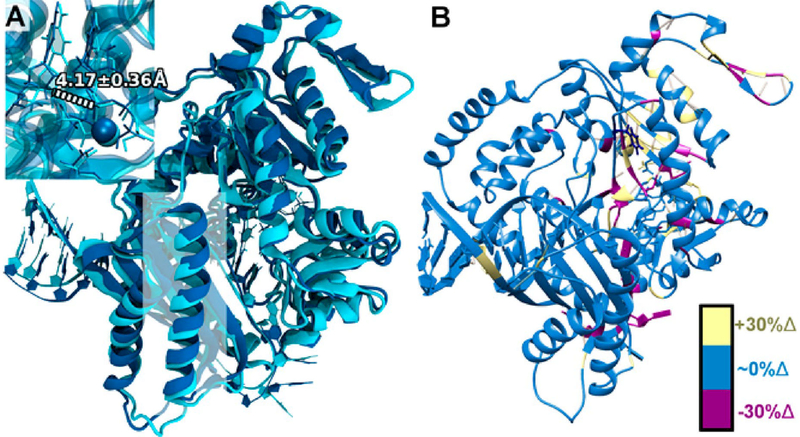
Figure 10.
Structural comparisons between WT pol κ with the correct incoming nucleotide (cyan) and the active F192C variant with the incorrect incoming nucleotide (dark blue). (A) Structural overlay between WT pol κ with incoming dG:dC (cyan) and pol κ F192C with incoming dG:dT (dark blue) with α helix residues ~427–447 highlighted in a white square. Distances in the active site close-up denote the average O3′ and Pα distance (in Å) for the F192C variant with dG:dT. (B) Changes in hydrogen bonding for the F192C variant with incoming dG:dT compared with WT pol κ with incoming dG:dC. Residues with an increase of 30% or more in hydrogen-bonding character compared with WT pol κ are highlighted in yellow; residues with similar hydrogen-bonding character are in blue; and residues with a decrease of 30% or more in hydrogen-bonding character compared with WT pol κ are highlighted in magenta.

