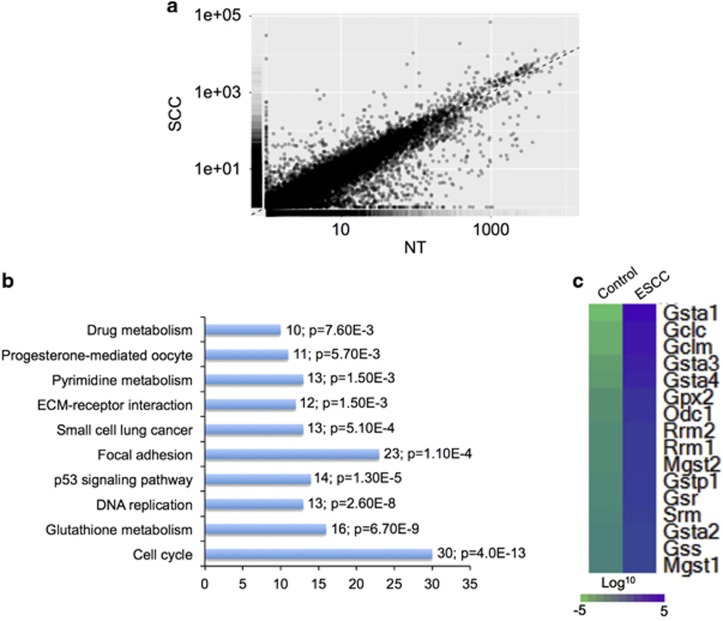
Figure 2.
RNA-Seq revealed the upregulation of the glutathione metabolism pathway in ESCC. (a) Scatter plot generated from RNA-Seq data demonstrates that a large number of transcripts were altered in ESCC compared with control. (b) Selected enriched KEGG pathways in ESCC, ordered from top to bottom from highest to lowest P-value. Numbers of transcripts and P-value in each pathway are indicated in the text next to each pathway. (c) Heat map of 16 differentially expressed genes involved in glutathione metabolism.

