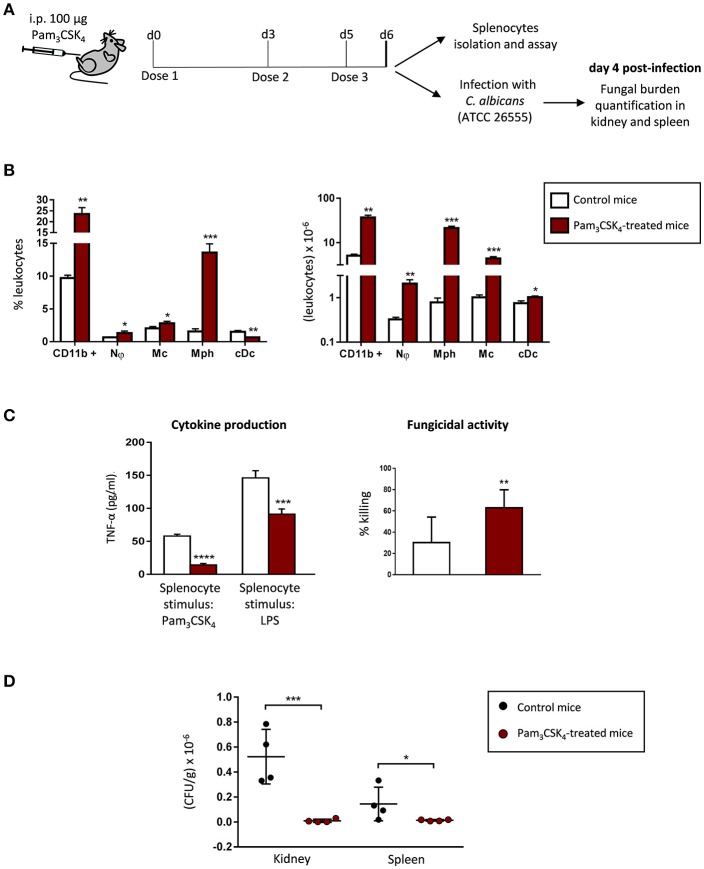
Figure 4.
Extended TLR2 agonist treatment protects mice from systemic C. albicans infection, induces myeloid cell expansion in the spleen, and impacts the cytokine production and the fungicidal activity of splenocytes. (A) Schematic protocol (as described in section Materials and Methods). WT mice were given 100 μg of Pam3CSK4 by intraperitoneal injection at days 0, 3, and 5 (3 doses), and 24 h after the final dose, mice were injected intraperitoneally with 30 × 106 yeasts of C. albicans ATCC 26555, or were sacrificed to isolate the spleen. Four days post-infection, mice were sacrificed to assess the outgrowth of the yeasts in the kidney and spleen. (B) Frequency and absolute numbers of myeloid cells per spleen as determined by flow cytometry (n = 2 mice per treatment group). Results are expressed as means ± SD of pooled data from two experiments. *P < 0.05, **P < 0.01 and ***P < 0.001 with respect to control mice. Nϕ, neutrophils; Mc, monocytes; Mph, macrophages; cDc, classical dentritic cells. (C) TNF-α production and fungicidal activity of splenocytes. Splenocytes were plated at a density of 2.5 × 10⁶ cells in 0.5 ml of complete cell culture medium. For cytokine assays, splenocytes were challenged with Pam3CSK4 (100 ng/ml) or LPS (100 ng/ml) for 24 h. TNF-α levels in cell-free culture supernatants were measured by ELISA. For fungicidal activity determination, splenocytes were challenged with 100,000 viable PCA2 yeasts and incubated for 4 h. C. albicans cells were also inoculated in culture medium without murine cells (control). After incubation, samples were diluted, plated on Sabouraud dextrose agar and incubated overnight at 37°C; CFUs were counted and killing percentages were determined as follows: % killing = [1 – (CFUs sample at t = 4 h)/(CFUs control at t = 4 h)] × 100. Triplicate samples were analyzed in each assay. Results are expressed as means ± SD of pooled data from two experiments. **P < 0.01, ***P < 0.001 and ****P < 0.0001 with respect to control cells (splenocytes from control mice). (D) The fungal burden in kidneys and spleens are expressed as CFUs per gram of tissue. Results are expressed as means ± SD of pooled data from two experiments (n = 2 mice each group per experiment). *P < 0.05 and ***P < 0.001 with respect to control mice (infected and not treated with the TLR2 agonist).

