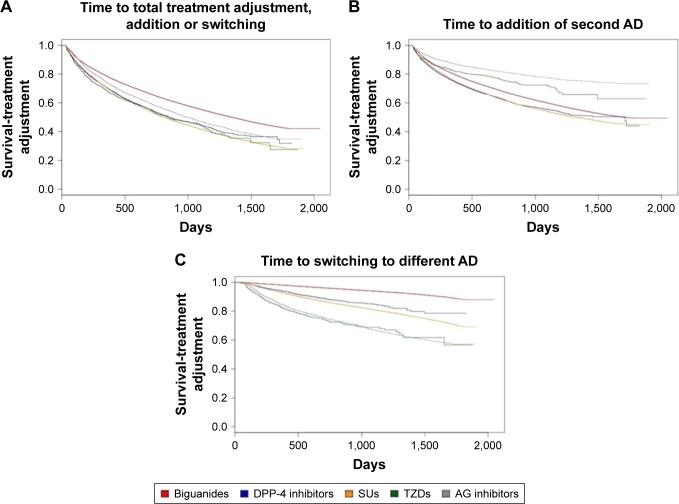
Figure 2.
Kaplan–Meier curves for cumulative hazard of treatment adjustment (addition and switching) by study cohorts.
Notes: (A) Describes the time till the first treatment adjustment (addition and switching combined) and compares differences among the study cohorts (B) for the addition component and (C) for the switching component separately. Logrank test, P,0.001 for all comparisons.
Abbreviations: AG, α-glucosidase; TZD, thiazolidinedione; SU, sulfonylurea; DPP-4, dipeptidyl peptidase-4; AD, antidiabetic drug.

