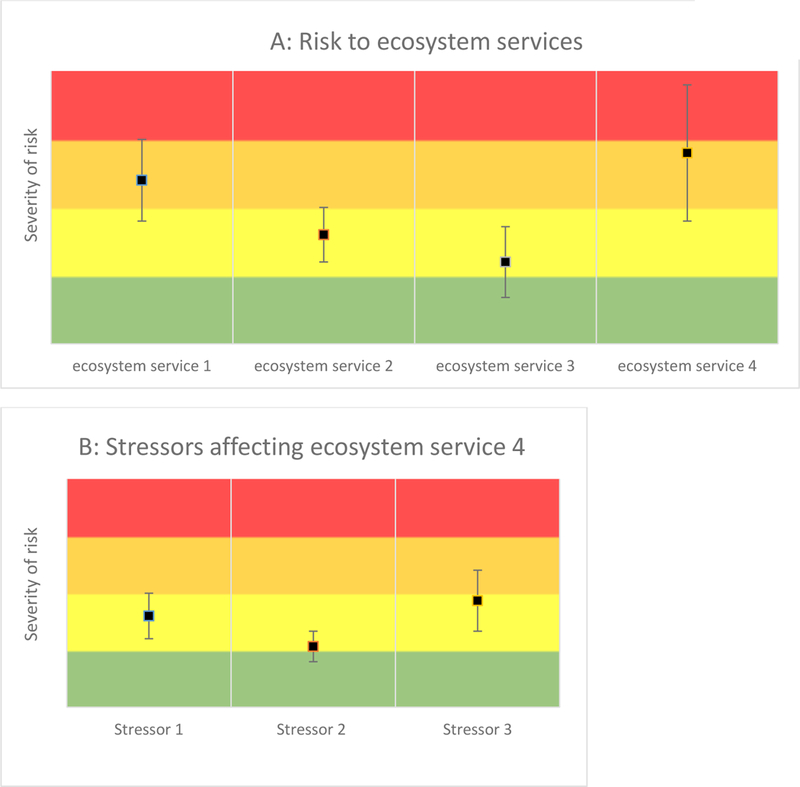
Figure 3.

A visual approach to risk assessment and communication for both risks to ecosystem services (A) and severity of risk to ecosystem services from different stressors (B). This visual approach can incorporate both quantitative and qualitative data, and uncertainty, while allowing for risk management prioritization. Red indicates relatively high risk, green relatively low risk. Stressors and risks can also be color coded as shown (e.g., to distinguish local from regional stressors, biological from chemical stressors, etc).
