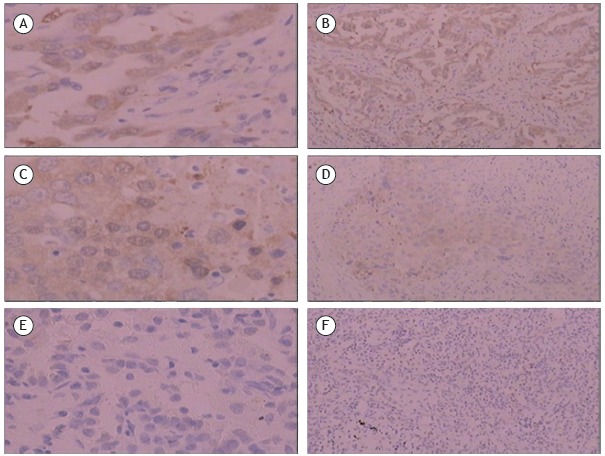
Figure 1. Photomicrographs showing α-enolase (ENO1) expression in lung tissue samples (immunohistochemistry using the streptavidin-peroxidase staining method). Positive signs are visualized as yellow or brownish yellow granules. In A and B, adenocarcinoma tissue samples showing positive ENO1 expression (magnification, ×400 and ×100, respectively). In C and D, squamous cell carcinoma tissue samples showing positive ENO1 expression (magnification, ×400 and ×100, respectively). In E and F, pulmonary inflammatory pseudotumor tissue samples showing negative ENO1 expression (magnification, ×400 and ×100, respectively).

