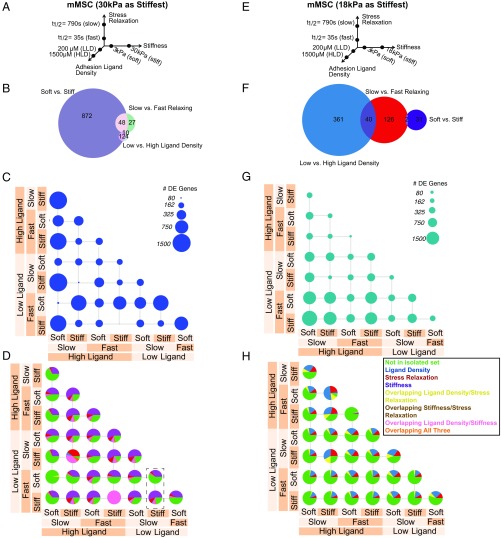
Fig. 1.
Transcriptomic comparison of material parameter sensing in mMSCs. (A–D) Transcriptomic comparison of material parameters sensing with 30 kPa as the high stiffness. (E–H) Transcriptomic comparison of material parameters sensing with 18 kPa as the high stiffness. (A and E) Schematic of experimental conditions for mMSC culture. Hydrogels were fabricated in each of the eight combinations of the low- and high-parameter values and cells were seeded at a density of 10 million cells per milliliter. (B and F) Venn diagrams of DE genes in mMSCs for each material parameter comparison after controlling for other parameters. The numbers of DE genes shared by two parameters are indicated in the overlap in circles. (C and G) Number of DE genes in mMSCs for all pairwise material comparisons. Circle area corresponds to the number of DE genes as indicated in the legend. (D and H) Fraction of DE genes from C and G described by decoupled genes in B and F for all pairwise material comparisons in mMSCs. Green, DE genes not found in the sets from B and F; blue, DE genes from ligand density set from B and F; red, DE genes from stress relaxation set from B and F; purple, DE genes from stiffness set from B and F; yellow, DE genes from overlapping ligand density and stress relaxation set from B and F; brown, DE genes from overlapping stiffness and stress relaxation set from B and F; pink, DE genes from overlapping ligand density and stiffness set from B and F; orange, DE genes from overlapping ligand density, stiffness, and stress relaxation set from B and F. The dashed box in D highlights a comparison in which comparing one material parameter (stress relaxation) results in a different pie chart if the background stiffness is different.

