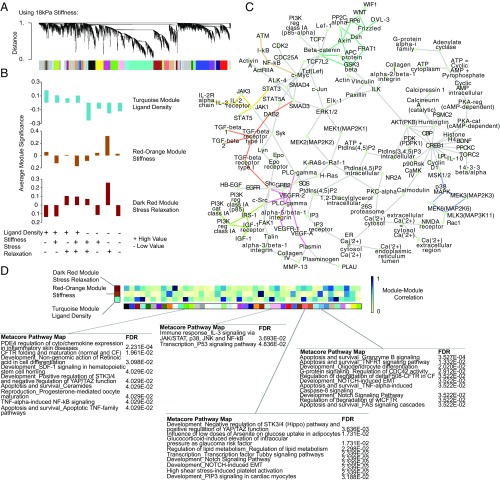
Fig. 3.
WGCNA of material parameter sensing networks in mMSCs. (A) Cluster dendrogram of gene expression showing module identification from WGCNA using an unsigned network and a soft thresholding parameter of 10 for the dataset containing 18-kPa hydrogels as the stiffest condition. (B) Selection of modules that most closely map to ligand density, stiffness, and stress relaxation for the dataset containing 18-kPa hydrogels as the stiffest condition. Average module significance is plotted as a function of each material, showing the correspondence between the module and that parameter of interest. These modules are identified in SI Appendix, Fig. S13. (C) Putative gene network seeded using the top hub genes from each of the modules corresponding to ligand density, stiffness, and stress relaxation (turquoise, red-orange, dark red). Enriched subnetworks were inferred using Metacore software and the three most significantly enriched (highest z-score) subnetworks were chosen and merged to arrive at the network shown. Connections corresponding to the Wnt (teal), TGF-β (orange), VEGF (pink), NF-κB (brown), Jak/STAT (yellow), IGF (green), and MAPK (purple) pathways are highlighted. (D) Heatmap showing absolute value of spearman correlations between the turquoise, orange-red, and dark red modules and all other modules, calculated by correlating the average expression of each module’s member genes. Module member genes for select comparisons showing particularly high or low correlations to the turquoise, orange-red, and dark red modules were selected and the most significant Metacore PathwayMaps were identified using these genes as seeds. Blue corresponds to high correlations and white to low correlations.

