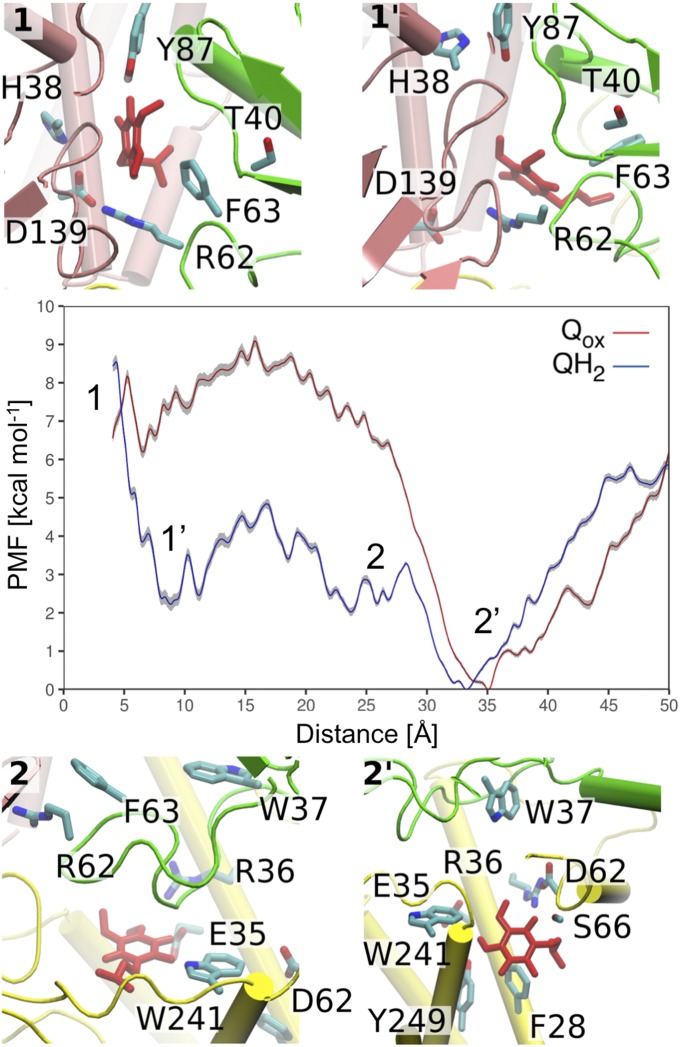
Fig. 3.
The free energy (PMF) profiles (in kilocalories per mole) obtained from US simulations for oxidized (Qox, red) and reduced (QH2, blue) short-tailed Q1 species. The PMF shows the standard deviation of the statistical error (in gray), which was estimated by bootstrap analysis. (Insets) Structural snapshots corresponding to transient binding sites 1, 1′, 2, and 2′ in the PMF profile. See also SI Appendix, Fig. S3 for a close-up of site 2′. Overlaps in the sampled reaction coordinates are shown in SI Appendix, Fig. S19.

