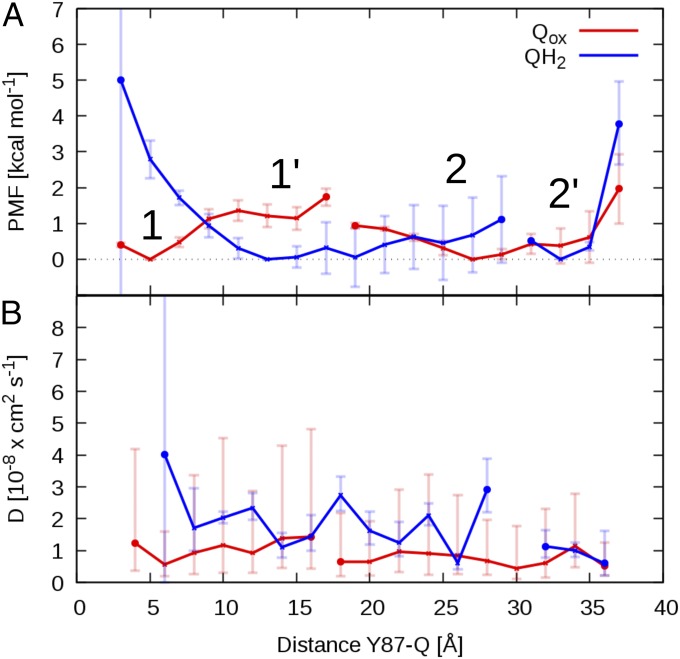
Fig. 4.
Free energy (PMF) profile and diffusion coefficient of Qox (red) and QH2 (blue) in the Q tunnel. (A) Free energy profiles as a function of Tyr-87Nqo4(OH)–Q distance and (B) corresponding position-dependent diffusion coefficient profiles extracted from unbiased equilibrium MD simulations from system setup 2 by a Bayesian analysis using a 1D diffusion model. The two PMF profiles are shifted vertically with their global minimum set to zero. In A 1, 1′, 2, and 2′ indicate local minima in the Q-binding cavity for the Qox and QH2 headgroup, respectively. Marked gaps in the profiles indicate unresolved free energy differences in rarely sampled areas of the reaction coordinate (SI Appendix, Fig. S5). Error bars in the PMF indicate standard errors of the mean, which were estimated by block averaging (Methods).

