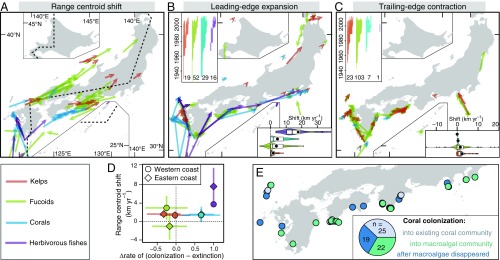
Fig. 2.
Observed range shifts for kelps, fucoids, corals, and deforestation by herbivorous fishes. (A–C) Location, direction, and magnitude (arrow length) of observed shifts for (A) range centroid shifts (n = 82), (B) leading-edge expansions (n = 116), and (C) trailing-edge contractions (n = 134). (A) Shifts are shown for each of the 45 study species from the 1970s to the 2000s divided into western and eastern coasts (dashed line), estimated by multiresponse linear models (SI Appendix, SI Methods). Inset violin plots in B and C represent summaries of shift rates with mean values in circles. Inset bar plots in B and C represent year range of each shift, with the number of shifts for each taxa. (D) Relationship between centroid shifts and differences in the rates of colonization against local extinction (mean ± SD). (E) Processes of community shifts by corals with the number of each type of the processes.

