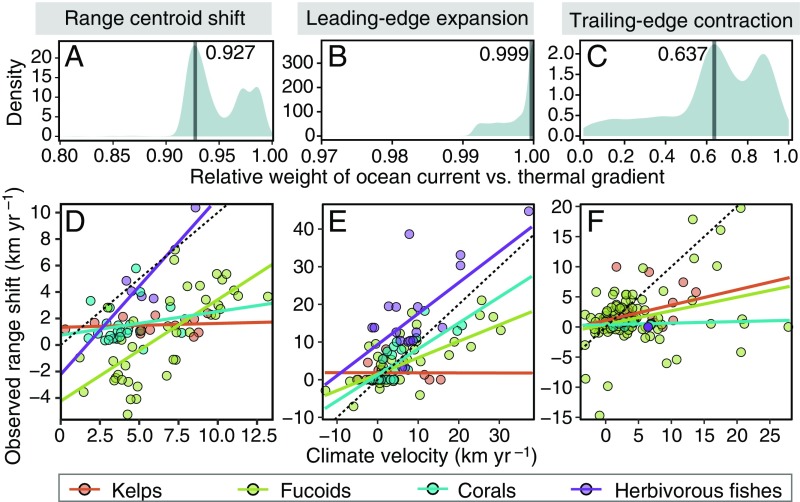
Fig. 3.
Predicted shift rates based on climate velocities for (A and D) range centroid shifts (n = 82), (B and E) leading-edge expansions (n = 114), and (C and F) trailing-edge contractions (n = 124). (A–C) Bayesian posterior distribution of the relative weight of effects by ocean current against thermal gradient on climate velocity. (D–F) Relationship between the observed and predicted shifts by a climate velocity based on the coupled climate and current effects (Fig. 1C and SI Appendix, Fig. S3), estimated together with the relative weight. Bold vertical line in A–C indicates the maximum probability in the relative weight. Dotted and solid lines in D–F represent, respectively, the 1:1 line and the mean of model fits for kelps, fucoids, corals, and deforestation by herbivorous fishes.

