Fig. 5.
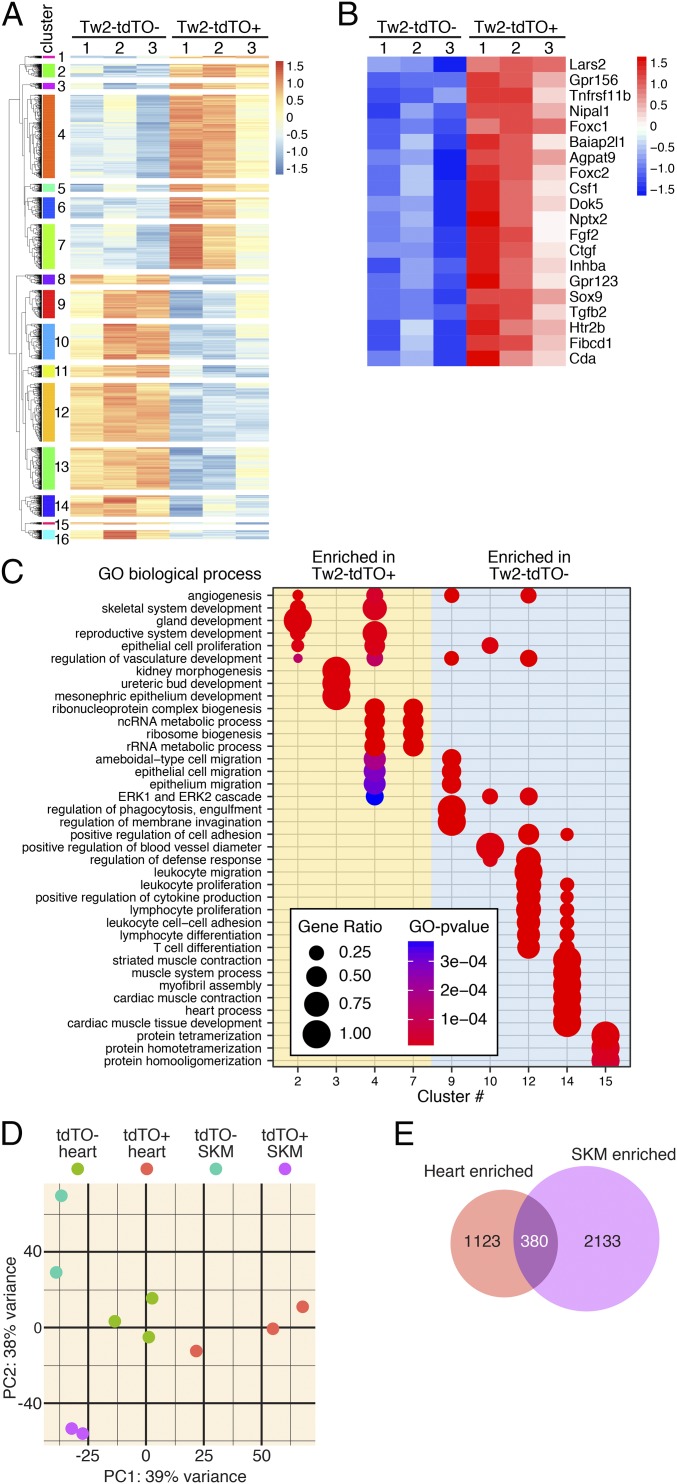
Transcriptome analysis of Tw2-tdTO+ cells in adult heart. (A) Heat map of 3,365 genes in freshly sorted Tw2-tdTO+ and Tw2-tdTO− cells in the heart as identified by RNA-seq. Cells were isolated by FACS from ventricles of Tw2-CreERT2; R26-tdTO mice at 10 d post-TMX treatment. n = 3 for each sample. Sixteen clusters of genes were identified and are indicated on the left. (B) The top 20 most enriched genes in Tw2-tdTO+ cells, as identified by RNA-seq. (C) The GO enrichment by differentially expressed genes in Tw2-tdTO+ and Tw2-tdTO− cells analyzed using the clusterProfiler R package. The size of the circle corresponds to the number of genes enriched for a particular GO term (gene ratio). The enrichment term is represented by colored dots (red indicates high enrichment, and blue indicates low enrichment). (D) PCA of Tw2-tdTO+ and Tw2-tdTO− cells in skeletal muscle (SKM) and hearts from Tw2-CreERT2; R26-tdTO mice identified by RNA-seq. (E) The Venn diagram indicates overlapping genes and genes that are differentially in Tw2-tdTO+ cells in heart and skeletal muscle.

