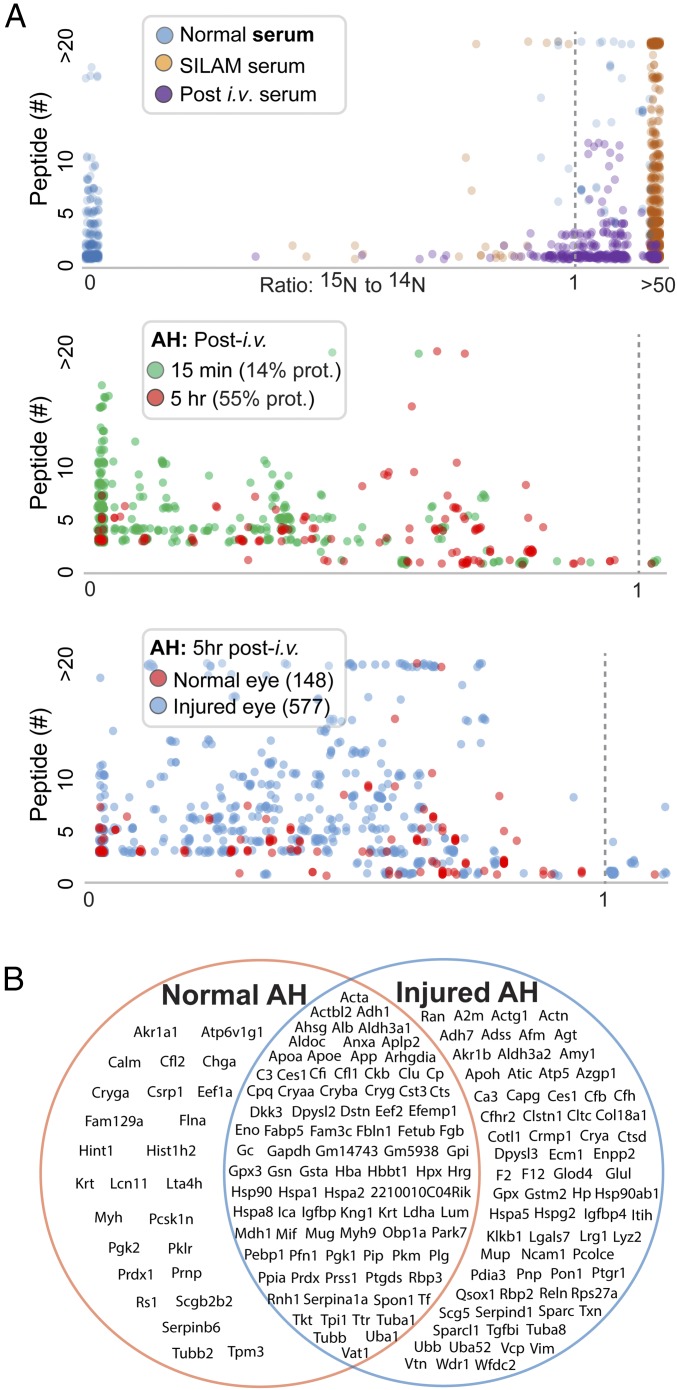
Fig. 2.
Proteomic detection of aqueous proteins in conjunction with 15N-labeled tracers. Each dot represents a protein. The heavy vs. light ratio for each protein is represented by the composite of all peptide ratios identified by MS that are assigned to the protein. (A, Top) Comparisons of sera collected from three different mouse groups: normal (14N) mice, SILAM (15N-labeled) mice, and normal mice at 15 min after receiving a bolus infusion of SILAM serum. The 15N/14N ratios are graphed between 0 and a “ceilinged” value at 50 to accommodate singleton proteins identified with only 14N or 15N peptides, respectively. (A, Middle) Comparison of aqueous humor (AH) collected at 15 min and 5 h. (A, Bottom) Comparison of the uninjured and injured eyes. (B) A total of seven eyes (three injured eyes and four uninjured eyes) were analyzed by MS, and aqueous humor proteins were detected. The three groups of proteins in the Venn diagram include proteins detected in all injured eyes but not in uninjured eyes, proteins detected in all uninjured eyes but not in injured eyes, and proteins detected in all seven eyes.

