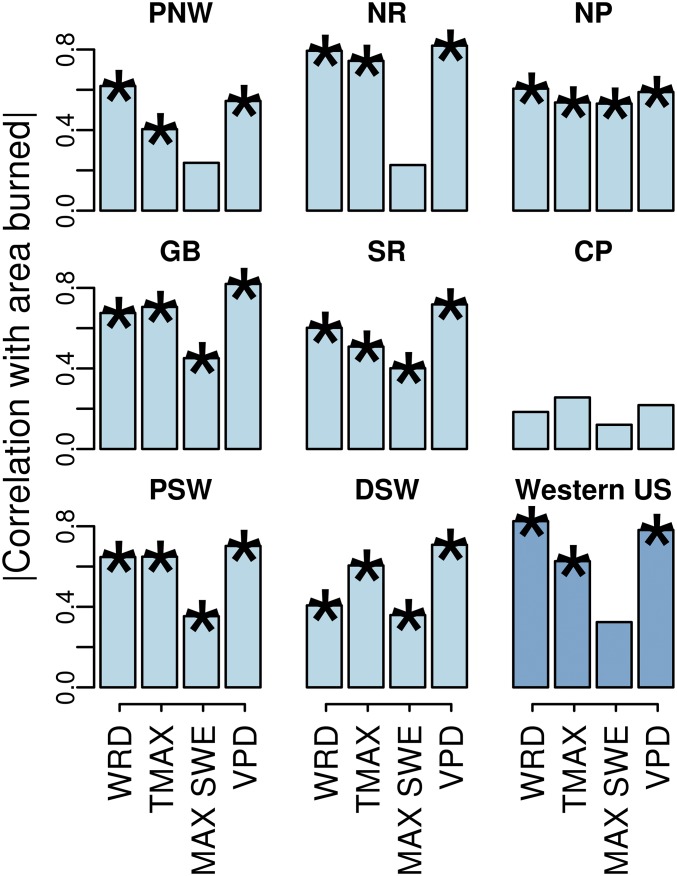
Fig. 2.
Linear correlations (Pearson’s r) between forest wildfire area burned (log transformed) from 1984 to 2015 and standardized May–September WRD, maximum temperature, maximum SWE, and maximum daytime VPD across eight NEON domains and for all forest areas in the western United States. An asterisk indicates statistical significance at P = 0.10. All negative values are expressed as absolute values for visual interpretation. NEON ecoregion names are identified in Fig. 1.

