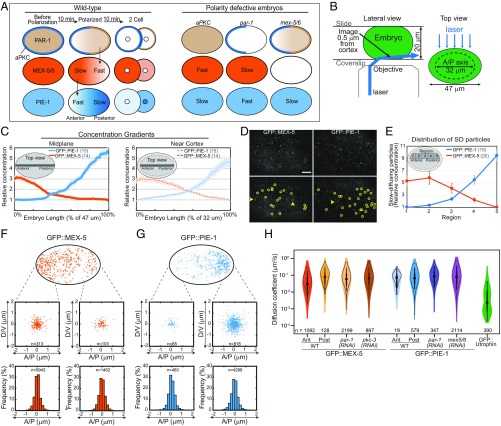
Fig. 1.
(A) Distribution of cortical and cytoplasmic proteins in WT and polarity defective embryos. In WT, all factors are symmetric before polarization, segregate along the A/P axis during polarization, and are inherited asymmetrically upon cell division. The ensemble mobilities of MEX-5 and PIE-1 are indicated (Fast or Slow). PAR-1 increases MEX-5/6 mobility in the posterior, and MEX-5/6 increase PIE-1 mobility in the anterior. PAR-1 also inhibits MEX-5/6 activity, such that PIE-1 mobility is fast in par-1 mutant embryos and slow in aPKC mutant embryos. (B) Schematic of near-TIRF imaging. An inclined laser was used to image in the cytoplasm, ∼0.5 μm from the cell cortex. The dotted line (Top view) indicates the region imaged. (C) The relative GFP::MEX-5 and GFP::PIE-1 gradients along the A/P axis at the cell midplane (47 μm long) and near the cortex (32 μm long). The gray bar indicates where the gradients were measured. The dashed black line (Right) indicates the portion of the embryo imaged near the cortex. (D) Representative single frames from near-TIRF movies of GFP::MEX-5 and GFP::PIE-1 (50-ms exposures). Particles detected by single-particle tracking are circled (Bottom). Arrows indicate examples of blurred FD particles. See Movies S4 and S5. (Scale bar: 5 μm.) (E) Relative number of SD particles in the indicated regions along the A/P axis (normalized to region 5 for GFP::MEX-5, region 1 for GFP::PIE-1). Error bars indicate SEM in this and all subsequent figures, and n is indicated in parentheses. (F and G) Tracks of GFP::MEX-5 and GFP::PIE-1 SD particles in WT. (Top) All tracks >250 ms from a 10-s movie are shown. (Middle) Displacement of SD particles along the A/P axis and perpendicular to the A/P axis (labeled dorsoventral, D/V). For each track, the starting point is at the plot origin and the dot indicates the final point. Tracks are from regions 1 and 5 of WT. (Bottom) Frequency of particle displacements along the A/P axis. Tracks >250 ms from 100-s movies are analyzed (20 embryos for GFP::MEX-5; 15 embryos for GFP::PIE-1). (H) Violin plot (log scale) of estimated Dc of GFP::MEX-5 SD particles, GFP::PIE-1 SD particles, and GFP::Utrophin speckles. Black circles, median; box, 25th and 75th percentiles; whiskers, 1.5× the interquartile range from the 25th and 75th percentiles. The empty gray violin shapes represent estimates from simulated tracks of pure Brownian motion. See SI Appendix, Fig. S1.

