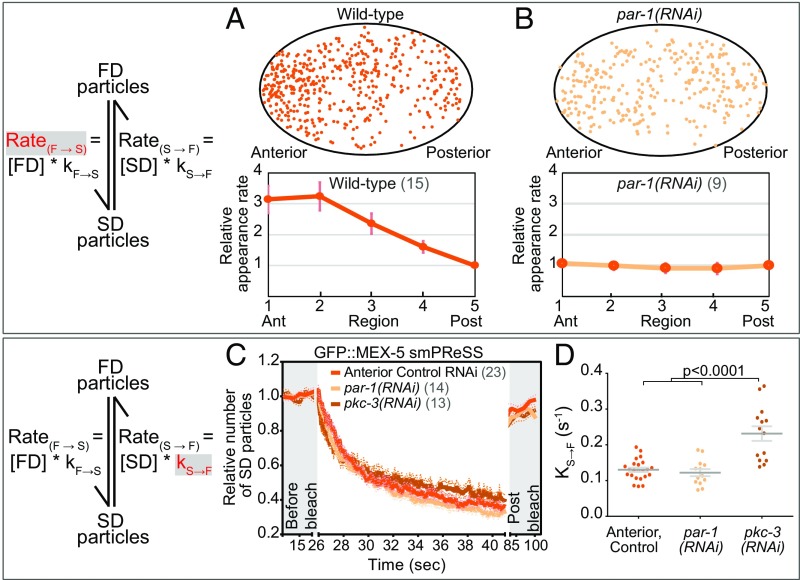
Fig. 2.
Kinetics of GFP::MEX-5 switching between the FD and SD states. (A and B) Appearance rate (RateF→S) of new GFP::MEX-5 SD particles (red in the schematic) along the A/P axis of WT and par-1(RNAi) embryos. (Top) Each dot marks the appearance of a new SD particle with trajectory >250 ms during a 10-s acquisition. The same WT embryo was analyzed in Fig. 1F. (Bottom) Mean appearance rate within five regions along the A/P axis (normalized to region 5). We cannot directly determine kF→S from RateF→S because [FD particles] under near-TIRF is unknown. (C) smPReSS curves of SD GFP::MEX-5 particles in the anterior of WT and along the entire A/P axis of par-1(RNAi) and pkc-3(RNAi) embryos. SD particle number is normalized to the mean of “before bleach” for each embryo and averaged among embryos. “Post bleach” is following a 45-s recovery. Dotted lines indicate SEM. (D) Apparent kS→F estimated from the smPReSS curves in C. Each dot represents an individual embryo. See SI Appendix, Fig. S2.

