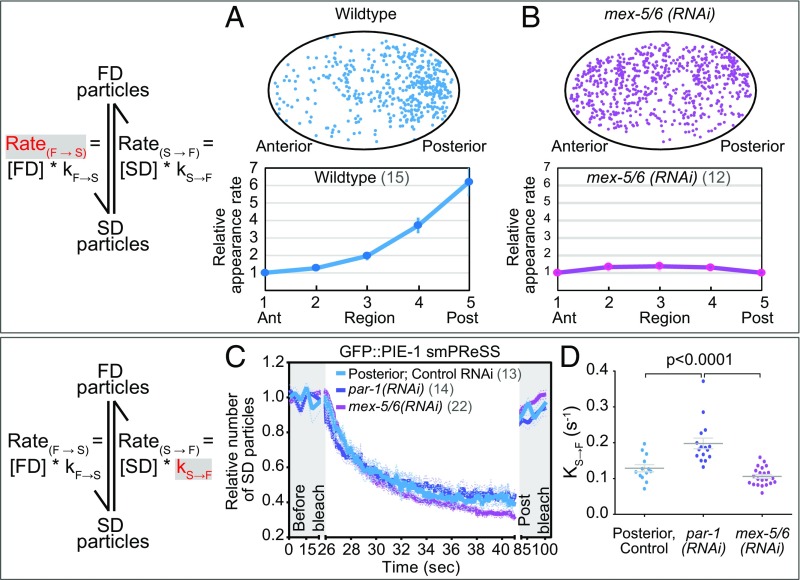
Fig. 3.
Kinetics of GFP::PIE-1 switching between the FD and SD states. (A and B) Appearance rate (RateF→S) of new GFP::PIE-1 SD particles in WT and mex-5/6(RNAi) embryos (as in Fig. 2A except the Bottom was normalized to region 1). The same WT embryo was analyzed in Fig. 1G. (C) smPReSS curves of SD GFP::PIE-1 particles in the posterior of WT embryos and along the entire A/P axis of mex-5/6(RNAi) and par-1(RNAi) embryos (as in Fig. 2C). (D) Apparent kS→F estimated from the smPReSS curves in C. See SI Appendix, Figs. S2 and S3.

