Fig. 5.
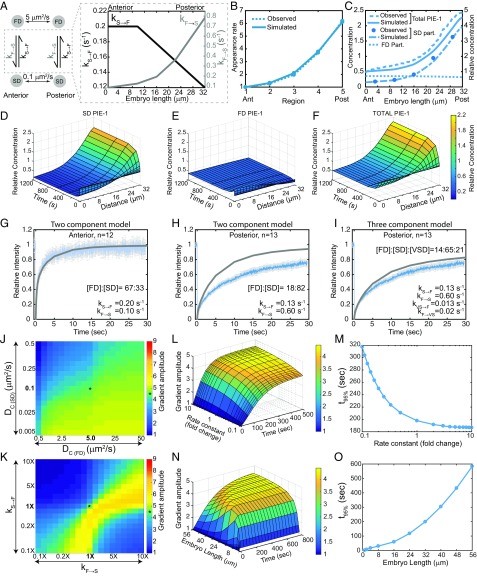
Simulation of PIE-1 gradient formation (32-μm-long A/P axis). (A) Schematic of the PIE-1 simulation indicating the Dc of the FD and SD particles and the gradients of kF→S and kS→F along the A/P axis. (B) Simulated and observed PIE-1 appearance rates in the five regions along the A/P axis. (C) Concentrations of FD (simulated), SD, and total (observed and simulated) PIE-1 molecules (as in Fig. 4C except normalized to the anterior). (D–F) Surface plots of PIE-1 SD particles (D), FD particles (E), and total PIE-1 (F) along the A/P axis from base simulations. (G–I) FRAP analysis of GFP::PIE-1 as in Fig. 4 I–L. (J) Sensitivity of the base PIE-1 simulation to changes in the Dc of FD and SD particles. (K) Sensitivity of the base PIE-1 simulation to changes in kF→S and kS→F, as in Fig. 4N except normalized to the anterior. (L) Surface plot of gradient amplitude as a function of diffusion-state switching kinetics. (M) Time required to reach 95% maximal gradient amplitude as a function of kinetics (from simulations in L). (N) Surface plot of gradient amplitude as a function of embryo length. (O) Time required to reach 95% maximal gradient amplitude as a function of embryo length (from simulations in N). See SI Appendix, Figs. S4–S7.

