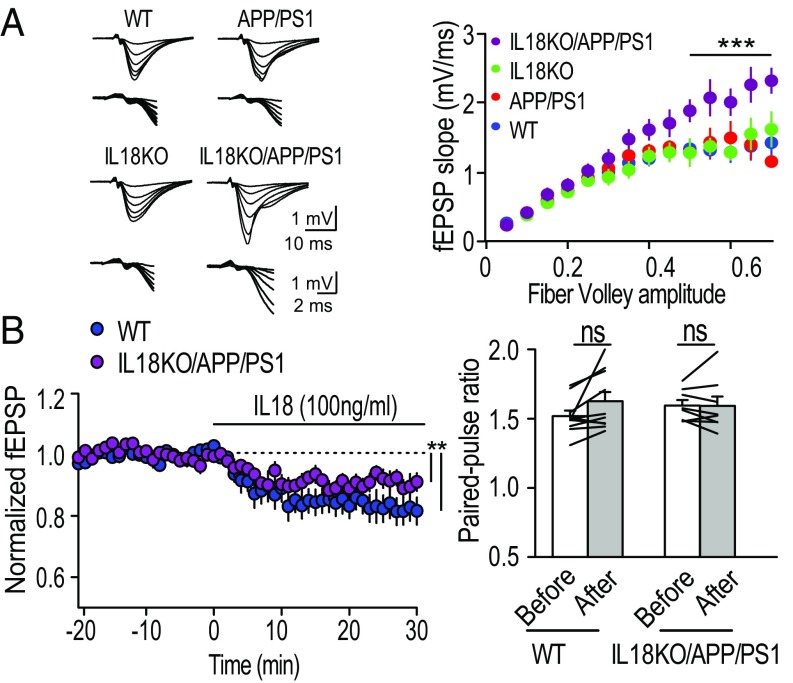
Fig. 6.
Increased basal excitatory synaptic transmission in IL18KO/APP/PS1 mice. (A, Left) Averaged sample traces (10 events) represent the response evoked with six different stimulus strengths from WT, APP/PS1, IL18KO, or IL18KO/APP/PS1 mice. The same sample traces are shown at two different scales. Stimulus artifacts were truncated. (A, Right) Summary of input–output relationships of field EPSPs at the Schaffer collateral-CA1 synapses. Number of data: WT [n = 15 slices per seven mice (15/7)], APP/PS1 (13/6), IL18KO (12/6), and IL18KO/APP/PS1 (11/6). ***P < 0.0001, two-way ANOVA with Tukey’s multiple comparison test. (B) Decreased excitatory synaptic transmission by IL18. (Left) Sample traces of field EPSPs of WT and IL18KO/APP/PS1 mice recorded at the times indicated in the summary graph. (Right) Summary graph of the averaged time course of recombinant IL18 protein (100 ng/mL). Initial EPSP slopes were measured, and the values were normalized to the averaged slope value measured during the baseline period (−15–0 min). Recombinant mouse IL18 was applied at 0 min. Number of data: WT [n = 10 slices per five mice (10/5)] and IL18KO/APP/PS1 (9/4). **P < 0.01, paired t test. Data shown are means ± SEM. ns, not significant.

