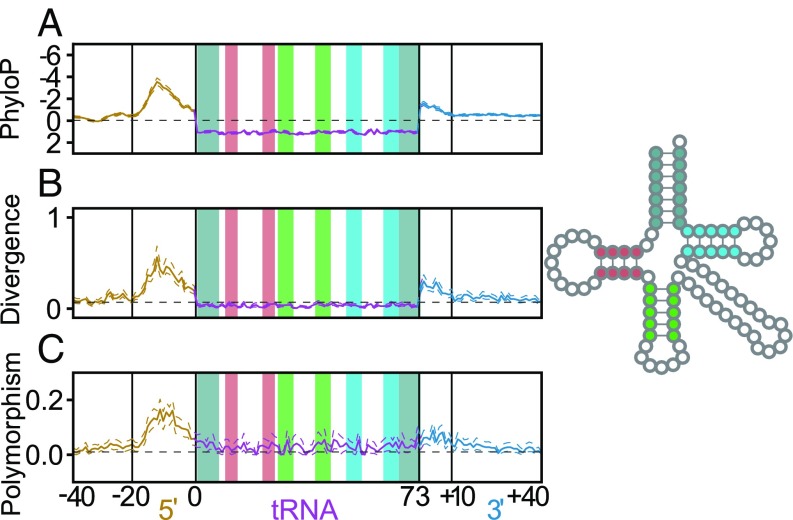
Fig. 1.
There is a strong pattern of variation in regions flanking human tRNA genes by three measures: relative to vertebrates, by comparison with Rhesus macaque alone, and within the human population. (A) The average PhyloP score (comparing humans to 100 vertebrate species) is plotted for each position within the tRNA and flanking region across all human tRNAs. (B) Divergence between the human and M. mulatta tRNA genes and their flanking regions. (C) Frequency of low-frequency SNPs (minor allele frequency ≤0.05) across all human tRNAs. The acceptor stem (gray), D-stem (red), anticodon stem (green), and T-stem (blue) are highlighted within the tRNA both in the linear plots and in the 2D structure legend to the right (2, 61). Nucleotide numbering below the plots is relative to mature tRNA boundaries, with inner and outer flanks demarcated by a shift in mutation rate (Methods). Dotted lines surrounding plots depict 95% CIs calculated by nonparametric bootstrapping by tRNA loci.

