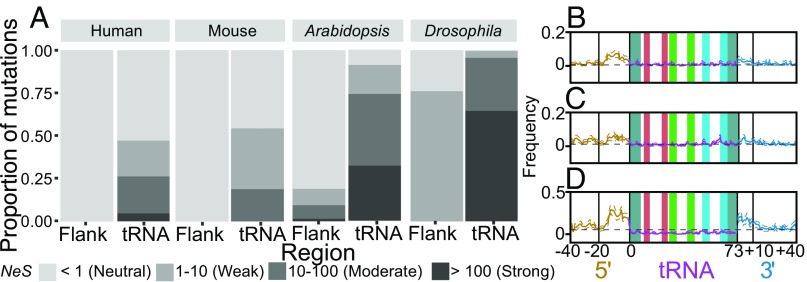
Fig. 4.
The estimated DFE indicates that high proportions of deleterious mutations in tRNAs are under strong selection. (A) Estimated DFE of new deleterious mutations for tRNA genes and inner 3′ flanking regions shown in human, mouse, A. thaliana, and D. melanogaster. Proportions of deleterious mutations are shown for each bin of purifying selection strength, estimated on a scale of NeS. Species are arranged by increasing effective population size. (B–D) Low-frequency SNPs plotted as in Fig. 1C for mouse (B), A. thaliana (C), and D. melanogaster (D).

