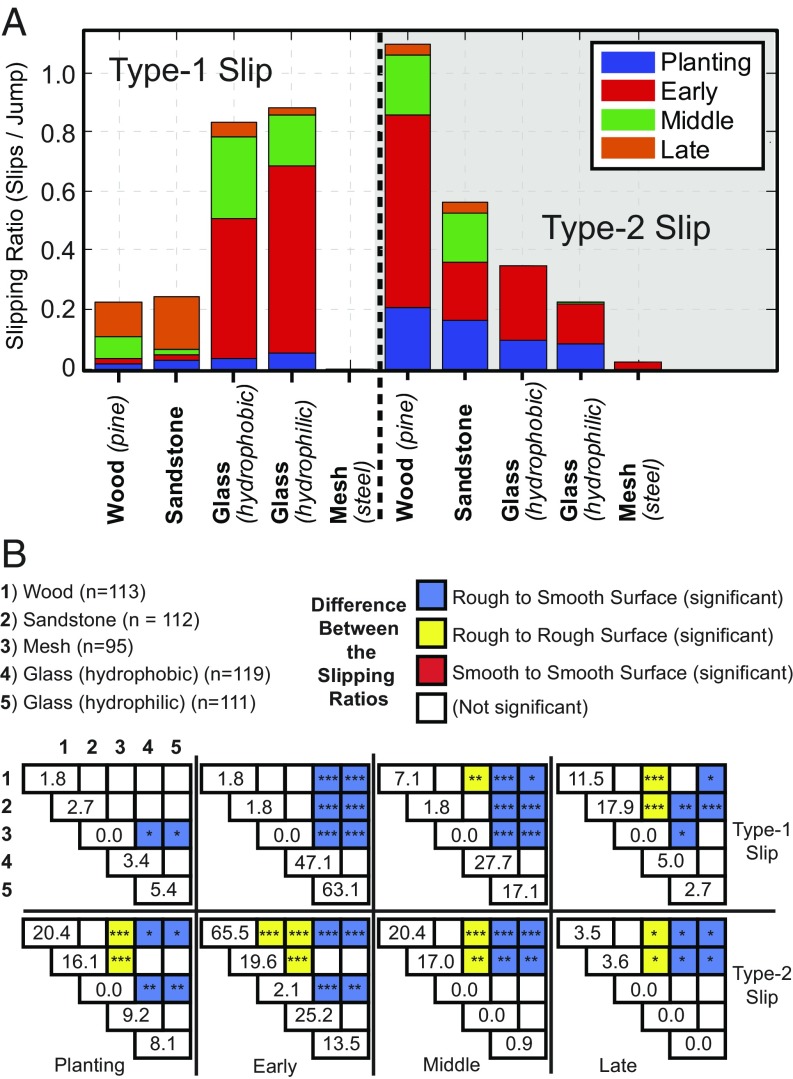
Fig. 4.
Locust experimental results per jump (per-leg rates are half), divided into slip type (type 1 or 2) and energy regions (planting, early, middle, or late). (A) Average slipping ratios (slips/jump) for each slip type on each material. (B) Material significance matrix, which compares the slipping ratios of each material within a single slip type and energy region of A, to determine significance of the differences in the means [e.g., type-1 slip and planting (upper left quadrant) presents the 10 unique significance measures between all five materials]. The diagonal values represent the slipping ratios (slips/jump), where zero values indicate that no slipping events were observed. *P 0.05; **P 0.01; ***P 0.001. n represents the number of trials on each material.

