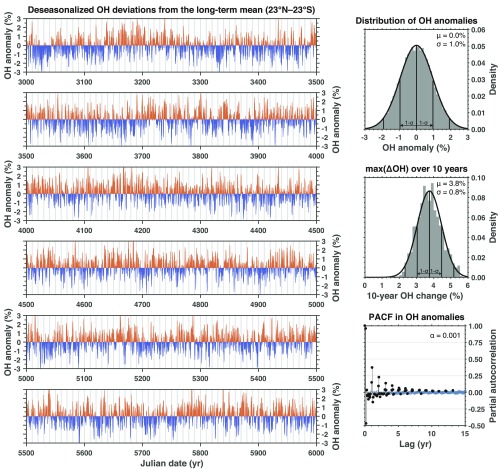
Fig. 1.
Statistics of OH anomalies in a preindustrial control simulation. Left shows the monthly OH anomalies in the tropics (23°N–23°S) from years 3,000 to 6,000 in the GFDL-CM3 control run. OH anomalies are the deseasonalized OH deviations (pressure-weighted mean, 300 to 800 hPa) from the long-term mean, normalized to the long-term mean, and expressed as a percentage: . Seasonal cycle is removed using a stable seasonal filter. Top Right shows the distribution of OH anomalies (gray bars) and a normal distribution fitted to the anomalies (black line). Middle Right is the maximum change in OH over a 10-y period (gray bars) and a normal distribution fitted to OH (black line). Bottom Right is the partial autocorrelation function (PACF) of the OH anomalies; filled black circles indicate significant lags ().

