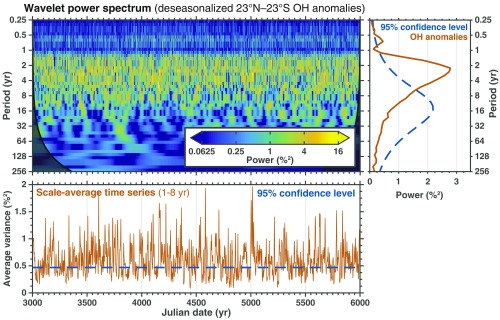
Fig. 2.
Wavelet analysis of the OH anomalies (300 to 800 hPa) in a preindustrial control simulation. Top Left is the bias-rectified local wavelet power spectrum of the OH anomalies from Fig. 1 using a Morlet wavelet following Torrence and Compo (4). Left axis is the Fourier period (in years), bottom axis is time (in years), and shading is the power (in %2). Right is the global wavelet spectrum for the OH anomalies (solid red line) and the 95% confidence level (dashed blue line) assuming red noise. Bottom is the scale-averaged wavelet power over the 1–8 y band for the OH anomalies (solid red line) and the 95% confidence level (dashed blue line) assuming red noise.

