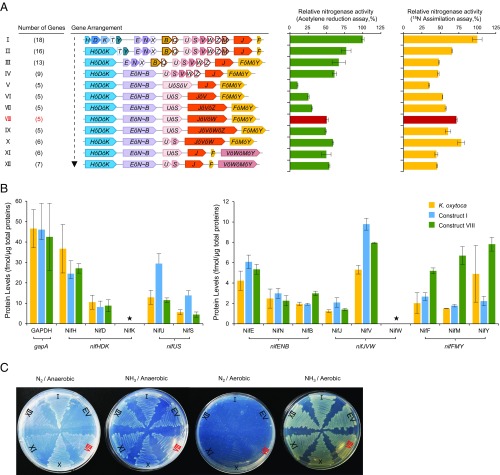
Fig. 3.
Assembly and characterization of the polyprotein-based nitrogenase system. (A) Schematic diagram showing the process of assembly by replacing native genes with regrouped giant genes. Numbers in parentheses on the left represent gene numbers (including giant genes and native genes) for each construct. Each ensemble was analyzed by both acetylene reduction and 15N assimilation to measure nitrogen fixation activity. The activities exhibited by the reconstituted operon-based system in E. coli [the pKU7017 plasmid is assembled with seven operon-based biobricks (5)] were assigned as 100% (29.1 ± 0.8 nmol C2H4/min/mg total protein for acetylene reduction assay and 1,172 ± 75 δ15N/14N‰ for the 15N assimilation assay) (row I). Error bars indicate the SD observed from at least two biological replicates. (B) Mass spectrometry analysis of protein levels from samples taken immediately after the acetylene reduction assays. The yellow bars represent protein samples from a nitrogen-fixing culture of K. oxytoca, grown under the same conditions as the E. coli cultures; the blue bars represent protein samples from the reconstituted operon-based nif system in E. coli (construct I in A), and the green bars represent protein samples from the polyprotein-based nif system (construct VIII in A); the GAPDH protein encoded by the E. coli gapA gene (EcgapA) was assigned as the internal reference. Asterisks mark proteins that could not be assigned (for NifK, chemical synthesis of the internal standard peptides failed, and, for NifW, no peptide with a detectable signal was identified). Error bars indicate the SD observed from three biological replicates. (C) Diazotrophic growth promoted by polyprotein-based nitrogenase systems in E. coli in the presence of 20 μM of IPTG. Roman numerals represent the corresponding assemblies in A. EV represents empty vector, used as a negative control. Control plates with strains grown in the absence of IPTG are shown in SI Appendix, Fig. S7.

