Fig. 1.
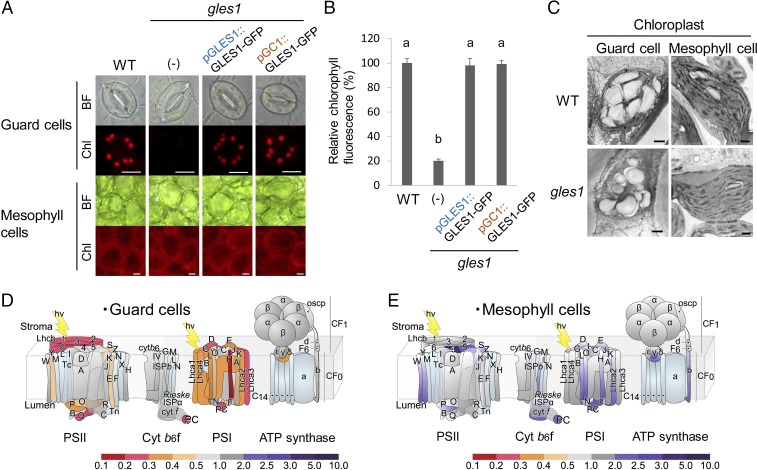
Mutation in GLES1 impairs chloroplast development in guard cells. (A) Guard cells in WT contain well-developed chloroplasts, but the imaged gles1 stomata have a negligible amount of chloroplasts and chlorophyll autofluorescence in their guard cells. In contrast, the gles1 mutant has normal chlorophyllous mesophyll cells. (Scale bars, 10 μm.) These gles1 phenotypes were restored in transformants expressing GLES1-GFP driven by GLES1’s own promoter or guard cell-specific GC1 promoter. BF, Bright Field; Chl, Chlorophyll fluorescence. Percentage relative chlorophyll fluorescence values ± SE (n > 100) are shown in B. The statistical significance was determined by a one-way ANOVA with Tukey–Kramer multiple comparison tests. Same letters (a and b) indicate no significant difference (P > 0.05). (C) Ultrastructure of plastids in WT and gles1 mutant plants. Mutant chloroplasts are as developed as WT chloroplasts in mesophyll cells. However, they fail to develop thylakoid membranes in guard cell. (Scale bars, 10 μm.) (D and E) Schematic view of gene expression of thylakoid-associated photosynthetic components integrated with microarray data. Fold-changes were calculated as gles1/WT control and are shown as a heat map. In achlorophyllous gles1 guard cell protoplasts that were sorted by FACS (SI Appendix, Fig. S2B: type I), the expression of photosynthesis genes is significantly down-regulated (D). In contrast, the expression of these genes is not down-regulated in the gles1 mesophyll cell protoplasts (E). Note that only transcripts for nuclear-encoded proteins could be detected on the microarrays used. Further information is available in SI Appendix, Table S1.

