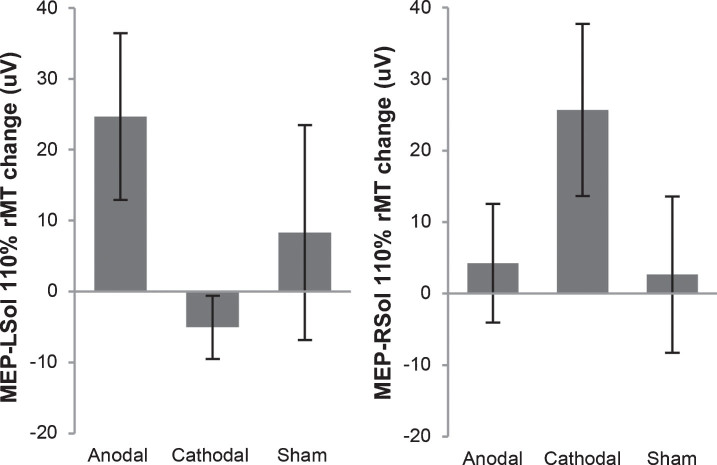
Fig.2.
Motor evoked potential (MEP) change in amplitude from before tsDCS to after tsDCS. MEPs were measured at 110% of resting motor threshold (rMT). MEPs resulting from stimulation of the right motor cortex, measured from the left soleus (MEP-LSol), ipsilateral to the reference electrode, increased following anodal and sham tsDCS, and decreased following cathodal tsDCS. None of these changes were significant. There were no significant differences between the 3 groups. MEPs resulting from stimulation of the left motor cortex, measured from the right soleus (MEP-RSol), contralateral to the reference electrode, increased following anodal, cathodal, and sham tsDCS. None of these changes were significant. There were no significant differences between the 3 conditions. Error bars indicate standard error.

